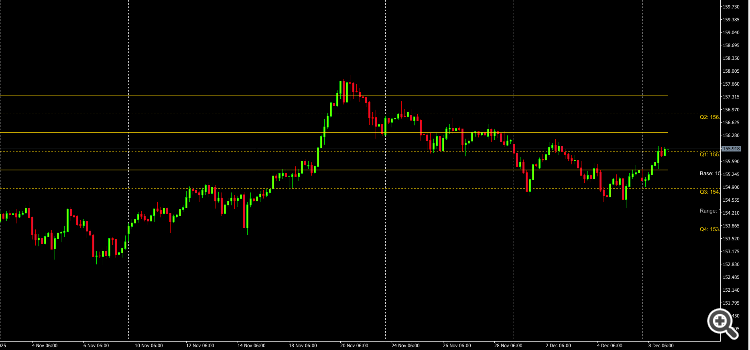
This indicator implements the "Quarters Theory" - a technical analysis concept that divides price movement into four quarters around a central base level. It's designed to work with multiple asset types (Forex, stocks, commodities, etc.) and provides visual quarter levels on the chart.
Quarters Theory Concept:
-
Base Level: Central reference price
-
Quarter 1: Price range from Base to Base + Quarter Range
-
Quarter 2: Price range from Base + Quarter Range to Base + 2*Quarter Range
-
Quarter 3: Price range from Base - Quarter Range to Base
-
Quarter 4: Price range from Base - 2*Quarter Range to Base - Quarter Rang
1. Flexible Base Level Calculation:
-
Current Daily Close: Latest closing price
-
Previous Day Close: Yesterday's closing price
-
Previous Week Close: Last week's closing price
-
Previous Month Close: Last month's closing price
-
Weekly/Monthly Open: Start of week/month price
-
Custom Level: User-defined price level
-
-
Pips: Forex-specific measurement
-
Points: Smallest price increment
-
Percentage: Percentage of base level
-
Absolute: Fixed price value
-
Automatically detects Forex vs. other instruments
-
Adjusts pip calculations for different symbol formats
-
Handles unavailable timeframes gracefully
2. Multiple Quarter Size Units:
3. Multi-Asset Support:
Trading Applications:
Support/Resistance:
-
Quarter boundaries act as dynamic support/resistance
-
Middle lines as potential reversal points
Trend Analysis:
-
Price in Quarter 1/2 suggests bullish bias
-
Price in Quarter 3/4 suggests bearish bias
-
Quarter transitions indicate trend changes
Range Trading:
-
Trade bounces between quarter boundaries
-
Look for reactions at quarter midpoints