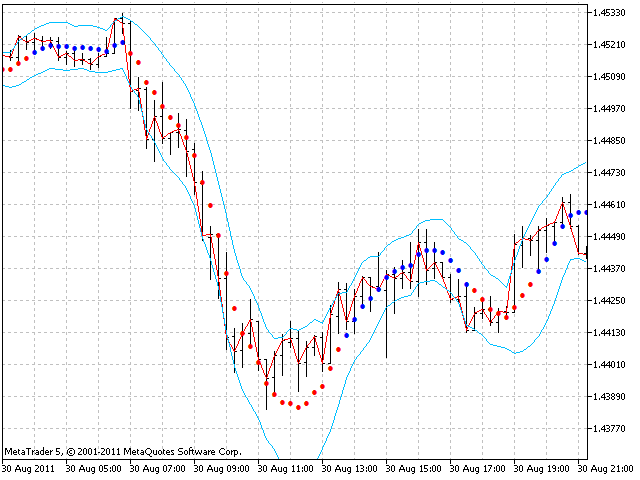
The dots, shown by the indicator are based on the linear regression. Regression period is set by the lr_per input parameter.
Two arrays are used to build the regression trajectory: LR_up draws the trajectory of ascending parts and LR_down draws the trajectory of descending parts. Deviation lines are controlled by stdev_koef deviation ratio. The indicator is created so that a trader can easily put any data instead of open prices by changing the code in one place only.