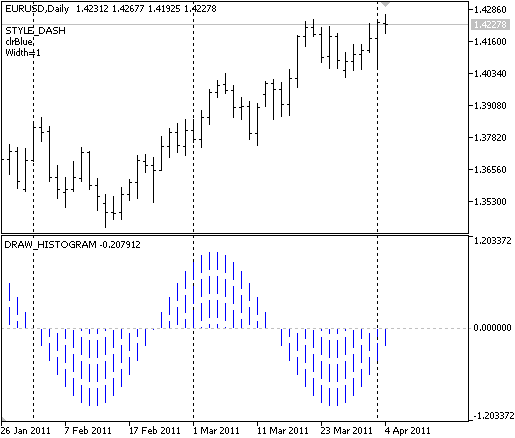
The indicator plots a graph of a sin(x) function in the separate window.
The histogram color, width and line style are changed randomly every N ticks. The period of the sin(x) function depends on bars input parameters. The DRAW_HISTOGRAM drawing style is used to plot the histograms (for example the ocsillators). It allows to avoid drawing some of the indicator's values by setting the PLOT_EMPTY_VALUE. Only one data buffer is needed for the DRAW_HISTOGRAM style.
Note that initial properties of the plot1 graphic plot (DRAW_HISTOGRAM) are defined using the #property preprocessor directive, further these properties changed randomly (OnCalculate() function). The N variable is defined as input parameter, it can be changed manually using the "Properties" window.
See also: The Drawing Styles in MQL5.