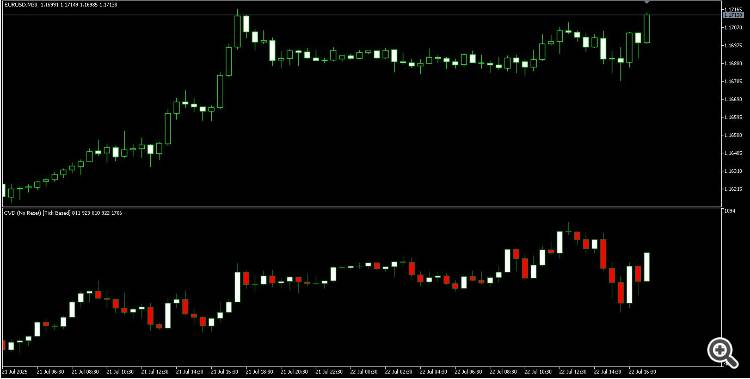
Lightweight, open-source CVD indicator for MetaTrader 5. It visualizes net buying vs selling pressure as CVD candles in a separate window — a simple start for volume and order flow analysis.
What it does
- Computes and plots CVD on your chart using M1 data (free version)
- Optional reset on timeframe boundaries (or never reset)
- Works on any symbol and timeframe
How it’s calculated (free version)
- For each M1 candle: direction = sign(close − open)
- Volume delta = direction × tick_volume
- CVD = cumulative sum of volume deltas
- Plotted as candles (open/close = previous/current CVD)
Inputs
- InpResetPeriod (ENUM_TIMEFRAMES): timeframe to reset CVD (e.g., H1, D1)
- InpNoReset (bool): set true to never reset
Install
- Copy CVD_MT5_v3_m1_codebase.mq5 to: MQL5/Indicators
- Compile in MetaEditor (F7) or restart MetaTrader 5
- Attach from Navigator → Indicators
Tips & troubleshooting
- First run may need MT5 to download M1 history. Be patient; scrolling the chart or changing timeframe can help MT5 fetch data.
- If CVD doesn’t update, ensure your symbol/timeframe has M1 history available.
- For slow terminals, try less busy symbols or fewer open charts.
Want more? Try the advanced paid version
Get the full-featured, professional edition:
- Link: https://www.mql5.com/en/market/product/154294
- Adds Tick-based mode (highest accuracy)
- Choose Calculation Period: Tick or M1–MN1
- Reset Period includes “Current Chart Period”
- Tick count per chart candle (shown in the Data Window)
- Enhanced diagnostics (tick time_msc ordering checks, readable error messages)
- Robust internal tick classification algorithms
Support
Questions or suggestions? Message via MQL5 profile.