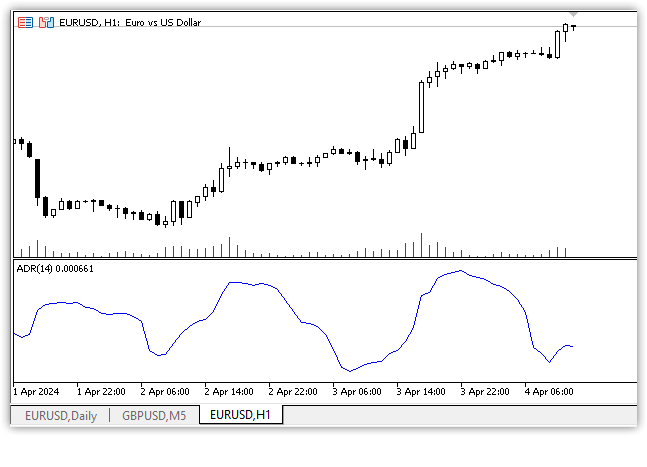
Average Daily Range is an indicator that measures the volatility of an asset. It shows the average price movement between the maximum and minimum over the last few days.
To calculate the average, the indicator first counts the difference between the maximum and minimum prices for a given number of days, and then calculates the average on the calculated data:
Average Day Range = SMA(High - Low, Length)

Average Day Range (Average Day Range) and ATR (Average True Range) technical indicators are used to analyse volatility in the markets, but are calculated and interpreted differently.
Average Day Range (ADR)
Average Day Range (ADR) measures the average amplitude of price fluctuations over a specific period. To calculate the ADR, you usually take the difference between the maximum and minimum price of each day for a selected period (for example, 14 days) and then calculate the average of these differences. ADR helps traders understand what volatility can be expected from an instrument during a trading day and use this information to plan trading strategies.
Average True Range (ATR)
The Average True Range (ATR) also serves as a measure of volatility, but is calculated in a slightly different way, which makes it a more versatile and accurate indicator. To calculate the ATR, you first determine the true range for each day, which is the maximum of the following three values:
- The difference between the current day's maximum and minimum prices.
- The difference between the current day's maximum price and the previous day's closing price.
- The difference between the current day's minimum price and the previous day's closing price.
Then, using these true range values, calculate the average value for a certain period (often 14 days). ATR takes into account the gaps between days, making it a more accurate indicator of volatility, especially in markets with large price gaps between trading sessions.
Main differences
- Calculation methodology: ADR simply considers the average range between the maximum and minimum prices for the day, while ATR also takes into account the gaps between the closes and opens of trading days.
- Usage: ADR is more commonly used to estimate daily volatility, while ATR is used to estimate volatility without time frame and can be used in a variety of trading strategies, including risk management and stop-losses.
- Flexibility: ATR is considered a more versatile indicator because of its ability to adapt to market conditions and take price gaps into account.


