
Author of the idea: Alex Spiroglou,author of the code: OU
This indicator is based on the principles of MACD-v: Volatility Normalised Momentum, a research paper authored by Alex Spiroglou in 2022. In that work, which received the Charles H. Dow Award (2022) from the CMT Association and the Founders Award (2022) for advances in active investment management, Spiroglou presented a refined interpretation of momentum by incorporating volatility-aware behaviour into a MACD-style framework. Inspired by this concept, the indicator here adapts the traditional MACD structure to provide clearer transitions, more stable signals and improved visual interpretation during periods of varying volatility.
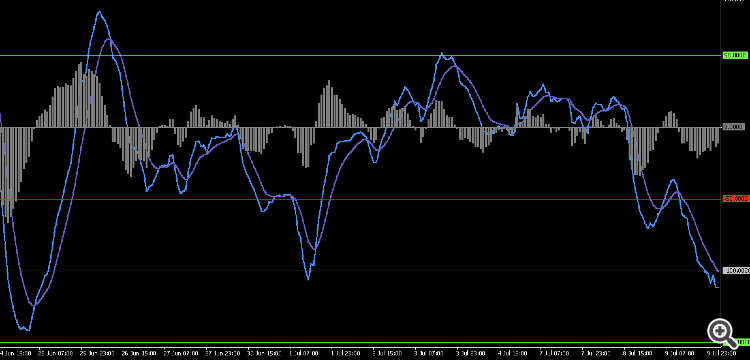
The indicator computes a fast and slow moving average of the selected price source, derives the MACD line as their difference, and forms a smoothed signal line. The histogram represents the gap between MACD and signal, which helps to identify momentum build-up, exhaustion, and early trend shifts. Crossovers and histogram expansion serve as primary trade-timing cues. Zero-line interaction reveals broader momentum regime changes, while contraction warns of potential reversals or consolidation phases.
Interpretation remains consistent with standard MACD theory, while providing a more balanced response to volatility. A MACD line crossing above the signal suggests rising bullish momentum; crossing below signals growing bearish momentum. Histogram expansion indicates acceleration, whereas flattening signals deceleration. Divergences between price and histogram may highlight weakening trends. The indicator functions effectively across all liquid symbols and timeframes, though confirmation with a higher-timeframe trend filter is recommended for robustness.
External variables
FastPeriod // period of the fast MA; controls responsiveness.
SlowPeriod // period of the slow MA; smooths broader behaviour.
SignalPeriod // smoothing for MACD line; defines signal timing.
MAType // MA calculation method (EMA/SMA/WMA).
PriceSource // price series for computations.
Mode // selects display style (classic, histogram-only, heatmap, dashboard).
ShowHistogram // toggles histogram visibility.
ShowLevels // optional reference levels (zero line or thresholds).
Alert settings // enables or disables crossover/zero-line alerts.
Color and style settings // controls plot appearance, including line thickness and behaviour during direction changes.
These variables enable users to tailor sensitivity, display, and alert behaviour to the trading style. No symbol-specific configuration is required; it is suitable for all markets.
Recommended use
The indicator may be applied on any timeframe. Intraday traders may prefer M15–H1, while swing or position traders will find H4–D1 advantageous. Combining the indicator with a trend filter significantly reduces noise and enhances cross-direction accuracy. The histogram is especially useful for assessing momentum exhaustion and identifying potential reversals when expansion slows.


