
The indicator is rewritten from MQL4, the author Alejandro Galindo, published by Scriptor, link to the source - https://www.mql5.com/en/code/7343.
How it works
The indicator draws the Pivot levels, the Pivot sublevels and the Camarilla levels.
Levels can be displayed by indicator buffers (by the whole history) and/or only current levels by horizontal lines.
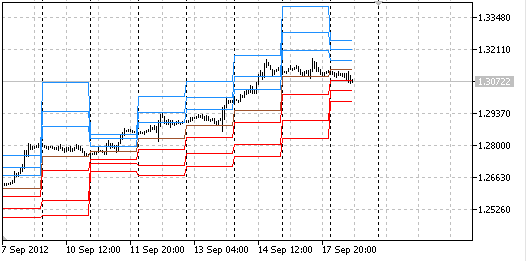
Drawing levels using the indicator buffers.
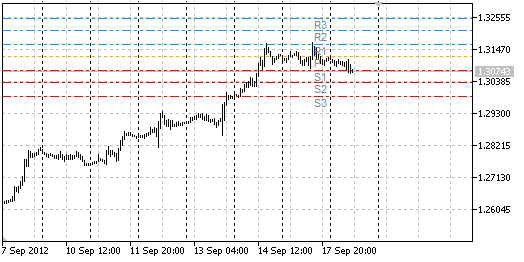
Drawing levels using the horizontal lines.
Parameters
- DayStartHour - Hour of day start.
- DayStartMinute - Minutes of day start.
- PivotsBuffers - Draw the Pivot levels using the indicator buffers.
- MidpivotsBuffers - Draw the Pivot sublevels using the indicator buffers.
- CamarillaBuffers - Draw the Camarilla levels using the indicator buffers.
- PivotsLines - Draw the current Pivot levels using the horizontal lines.
- MidpivotsLines - Draw the current Pivot sublevels using the horizontal lines.
- CamarillaLines - Draw the current Camarilla levels using the horizontal lines.
- ClrPivot - Color of the Pivot horizontal line.
- ClrS - Color of S1, S2, S3 horizontal lines.
- ClrR - Color of R1, R2, R3 horizontal lines.
- ClrM - Color of M0, M1, M2, M3, M4, M5 horizontal lines.
- ClrCamarilla - Color of the Camarilla horizontal lines.
- ClrTxt - Color of texts with horizontal lines names.
- AttachSundToMond - Attach Sunday bars to Monday.


