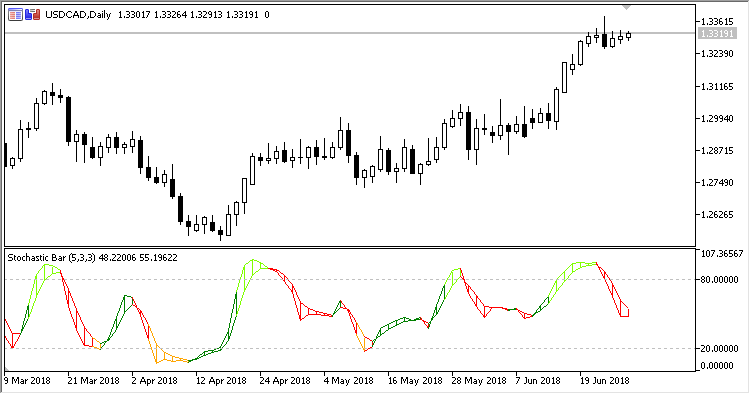
A simple indicator based on standard stochastic. Along with the Main and Signal lines of standard stochastic, it also draws a color histogram between these two lines. Histogram color depends on the lines positioning against each other and against the overbought/oversold lines.
It has seven configurable parameters:
- %K period - stochastic K line period;
- %D period - stochastic D line period;
- Slowing - stochastic slowing period;
- Method - sotchastic calculation method;
- Price field - stochastic calculation price field;
- Overbought - overbought level;
- Oversold - oversold level.
Colors:
- K > D and K < Overbought - green;
- K > D and K > Overbought - light green;
- K < D and K > Oversold - red;
- K < D and K < Oversold - orange.