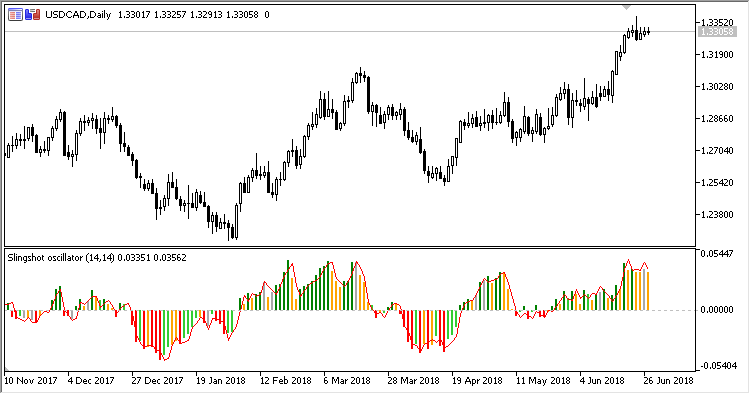
Oscillator Slingshot displays in the chart the price momentum histogram and signal line. The probable direction of the fitire price movement is marked in the histogram with different colors:
- Green - up-movement;
- Red - down-movement;
- Lime green - rolling back upwards or starting up-movement;
- Orange - rolling back downwards or starting down-movement;
- Gray - neutral market.
The indicator has four configured parameters:
- Period - calculation period;
- Applied price - calculation price;
- Signal period - signal line period;
- Signal price - signal line calculation price.
Calculations:
SValue = PriceSV - PriceSV[Period1] Signal = PriceSig - PriceSig[Period2]
where:
PriceSV - SMA(1, Applied price) PriceSig - SMA(1, Signal price) Period1 - Period Period2 - Signal period