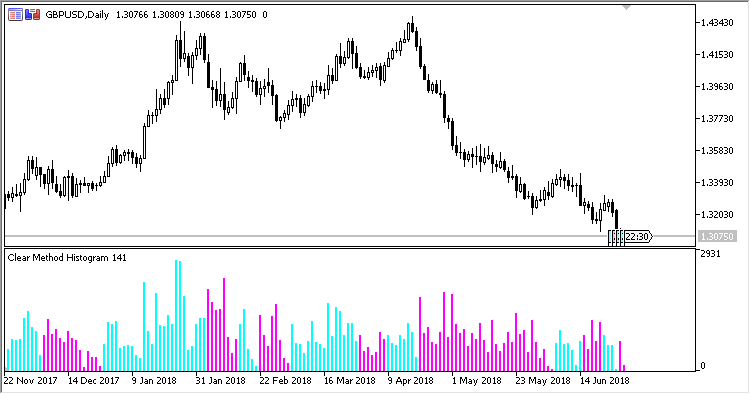
Indicator CMH (Clear Method Histogram) displays a color histogram of the current market trend. It is calculated by the "pure" method (without using any other indicators, only price) and has no configurable parameters.
Calculations:
-
If Swing > 0:
CMH = High - HL
Color - blue
-
If Swing < 0:
CMH = LH - Low
Color - pink
where:
HH = Maximum(High, PrevHH) LH = Minimum(High, PrevLH) HL = Maximum(Low, PrevHL) LL = Minimum(Low, PrevLL)
-
If Swing > 0 and High < HL:
Swing = -1 LL = Low LH = High
-
If Swing < 0 and Low > LH:
Swing = 1 HH = High HL = Low
-
Otherwise, if High < HL:
Swing = -1 LL = Low LH = High
-
Otherwise, if Low > HL:
Swing = 1 HH = High HL = Low