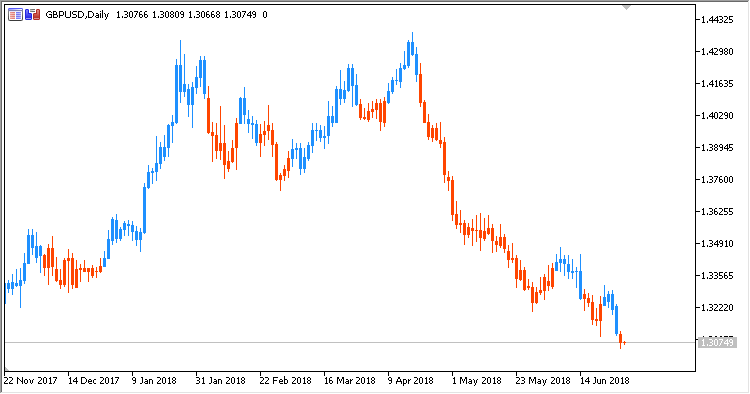
Indicator CMC (Clear Method Candles) displays colored candlesticks, based on the existing market trend. It is calculated by the "pure" method (without using any other indicators, only price) and has no configurable parameters. It is based on indicator Clear Method Histogram.
Calculations:
-
If Swing > 0, then candlesticks are blue
-
If Swing < 0, then candlesticks are red
where:
HH = Maximum(High, PrevHH) LH = Minimum(High, PrevLH) HL = Maximum(Low, PrevHL) LL = Minimum(Low, PrevLL)
-
If Swing > 0 and High < HL:
Swing = -1 LL = Low LH = High
-
If Swing < 0 and Low > LH:
Swing = 1 HH = High HL = Low
-
Otherwise, if High < HL:
Swing = -1 LL = Low LH = High
-
Otherwise, if Low > HL:
Swing = 1 HH = High HL = Low