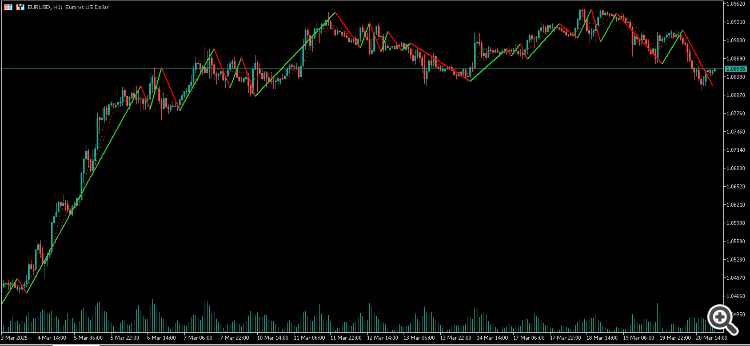
This is a static zigzag which connects the intersections of two moving average crossovers. It is another way to analyse moving averages.
When the fast period moving average crosses above the slow period moving average, it is a buy signal, and when the fast period moving average crosses under the slow period moving average, it is a sell signal. The zigzag will be forming a green leg at the bullish crossover, and will start the red leg at the next bearish crossover.
As the zigzag is static, it is to be read a certain way:
The formation of a downwards facing red leg is a buy signal, because the next leg will be green.
The formation of an upwards facing green leg is a sell signal, because the next leg will be red.
A backstep is used to help the zigzag legs become valid, and to push away noise that moving averages are naturally victim to. It is up to you which moving average periods work best. This is an experimental indicator with a new zigzag structure that's organized with enum cycles.