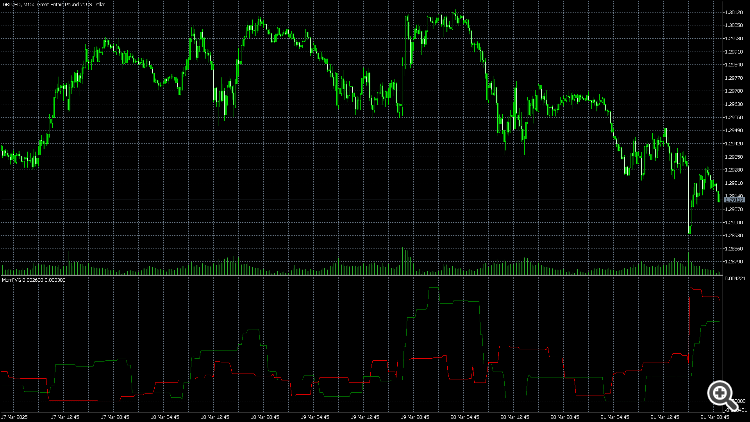
- The Green line represents the total amount of FVGs in uptrend (filled or unfilled) in the specified window_size.
- The Red line represents the total amount of FVGs in downtrend (filled or unfilled) in the specified window_size.
- Green above Red means upside momentum.
- Red above Green means downside momentum.
The indicator can also be applied as an exit indicator.


