
Explore the latest free tools from the MQL5 community. Here's a new indicator, expert advisor, or script for MetaTrader.
The standard RSI is added. If the value of the indicator is less than BuyOp and the current value of the indicator is greater than the previous one then we buy. If the value of the indicator is greater than SellOp and the current value is less than the previous one then we sell. Test is the period of the RSI. Trailing Stop that is used here was taken either from this forum or from the Alpari forum (I don't remember exactly). The auto-optimizer is added from the article: Automated Optimization of a Trading Robot in Real Trading.
Capture price channel breakouts with the Price Channel Expert Advisor. Precise entries and exits. Explore now.
The parameters for the optimization are: BuyOp, SellOp,Test.
The chart is only for one day because the parameters are optimized everyday.
It behaves very good on the M1. The best values are on EURJPY.
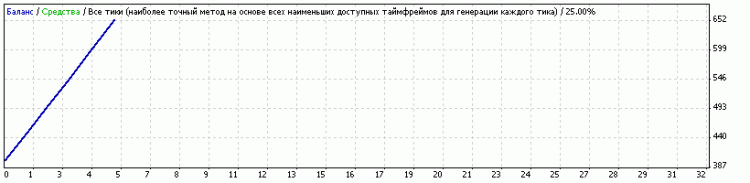
| Symbol | EURJPY (Euro vs Japanese Yen) | ||||
| Period | 1 Minute (M1) 2008.10.17 00:00 - 2008.10.17 22:59 (2008.10.17 - 2008.10.20) | ||||
| Model | Every tick (the most precise method based on all available least timeframes) | ||||
| Parameters | TakeProfit=50; Lots=0.1; RiskPercentage=10; TrailingStop=50; MaxOrders=1; BuyOp=29; SellOp=74; magicnumber=777; Test=11; SetHour=0; SetMinute=10; | ||||
| Bars in test | 2380 | Ticks modelled | 33018 | Modelling quality | 25.00% |
| Missmatched charts errors | 0 | ||||
| Initial deposit | 400.00 | ||||
| Total net profit | 254.46 | Gross profit | 254.46 | Gross loss | 0.00 |
| Profit factor | Expected payoff | 50.89 | |||
| Absolute drawdown | 39.31 | Maximum drawdown | 87.46 (17.25%) | Relative drawdown | 17.25% (87.46) |
| Total trades | 5 | Short positions (% won) | 3 (100.00%) | Long positions (% won) | 2 (100.00%) |
| Profit trades (% of total) | 5 (100.00%) | Loss trades (% of total) | 0 (0.00%) | ||
| Largest | profit trade | 52.07 | loss trade | 0.00 | |
| Average | profit trade | 50.89 | loss trade | 0.00 | |
| Maximum | consecutive wins (profit in money) | 5 (254.46) | consecutive losses (loss in money) | 0 (0.00) | |
| Maximum | consecutive profit (count of wins) | 254.46 (5) | consecutive loss (count of losses) | 0.00 (0) | |
| Average | consecutive wins | 5 | consecutive losses | 0 |
| № | Time | Type | Order | Volume | Price | S / L | T / P | Profit | Balance |
| 1 | 2008.10.17 00:32 | buy | 1 | 0.10 | 136.65 | 0.00 | 0.00 | ||
| 2 | 2008.10.17 02:11 | modify | 1 | 0.10 | 136.65 | 137.15 | 0.00 | ||
| 3 | 2008.10.17 02:24 | s/l | 1 | 0.10 | 137.15 | 137.15 | 0.00 | 49.13 | 449.13 |
| 4 | 2008.10.17 06:34 | sell | 2 | 0.10 | 137.07 | 0.00 | 0.00 | ||
| 5 | 2008.10.17 09:02 | modify | 2 | 0.10 | 137.07 | 136.54 | 0.00 | ||
| 6 | 2008.10.17 09:03 | s/l | 2 | 0.10 | 136.54 | 136.54 | 0.00 | 52.07 | 501.20 |
| 7 | 2008.10.17 11:18 | buy | 3 | 0.10 | 135.63 | 0.00 | 0.00 | ||
| 8 | 2008.10.17 15:59 | modify | 3 | 0.10 | 135.63 | 136.13 | 0.00 | ||
| 9 | 2008.10.17 16:02 | s/l | 3 | 0.10 | 136.13 | 136.13 | 0.00 | 49.13 | 550.33 |
| 10 | 2008.10.17 17:07 | sell | 4 | 0.10 | 136.74 | 0.00 | 0.00 | ||
| 11 | 2008.10.17 17:38 | modify | 4 | 0.10 | 136.74 | 136.21 | 0.00 | ||
| 12 | 2008.10.17 17:38 | s/l | 4 | 0.10 | 136.21 | 136.21 | 0.00 | 52.06 | 602.39 |
| 13 | 2008.10.17 19:26 | sell | 5 | 0.10 | 137.03 | 0.00 | 0.00 | ||
| 14 | 2008.10.17 20:24 | modify | 5 | 0.10 | 137.03 | 136.50 | 0.00 | ||
| 15 | 2008.10.17 20:24 | s/l | 5 | 0.10 | 136.50 | 136.50 | 0.00 | 52.07 | 654.46 |
It doesn't take part in the Championship because of the auto-optimization (it can be used under the Championship, and the code is not mine as well), and the idea came to me after the beginning of the Championship.
Build better strategies with RobotFX professional tools – check them out.
8513


