Real author:
faa1947
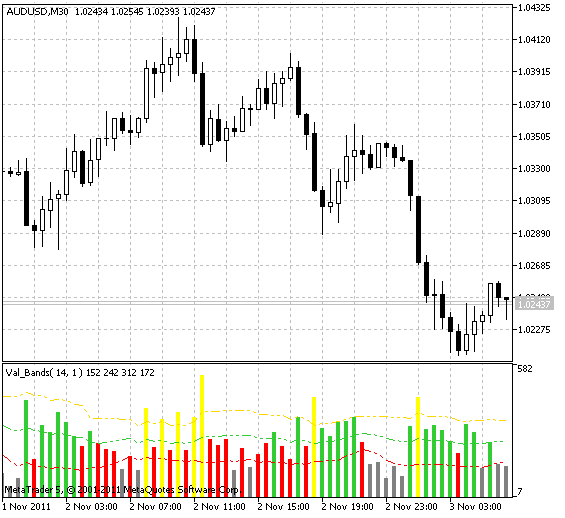
Candlesticks length volatility indicator:
- Histogram - candlestick length in points;
- Lines: averages from the candlesticks length with standard deviation;
- Settings are analogous to the Bollinger Channel.
Usage:
It is useful for tracking gaps on the market. The gap contains everything that is above the yellow line (histogram yellow bar) - crossing the upper border.
- TP (towards a position);
- SL (against a position);
- entry prohibition at this point;
- crossing the lower border (histogram gray bar) - flat
- crossing the lower border upwards (histogram red bar) - beginning of a trend.
This indicator was first implemented in MQL4 and published in Code Base at mql4.com 19.08.2010.