
WaveWeisBarForce - Accumulated wave volume (Weis)
WaveWeisBarForce is an indicator that applies the logic of volume waves (Weis) to identify accumulations and changes in market direction.
It adds up the volume while the trend remains unchanged. When the direction changes, it starts a new wave and resets the accumulation to zero.
Intensity is calculated by levels, according to the ratio between the volume of the current wave and the largest recent accumulation ( Intensity window).
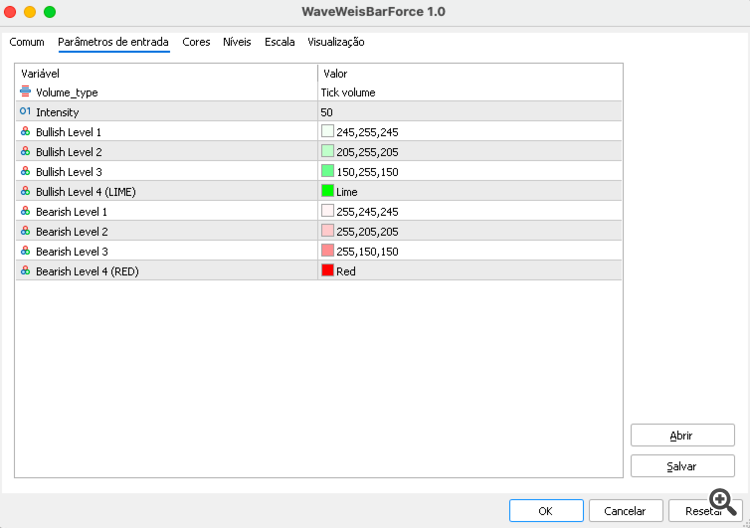
Input parameters
-
Volume_type - Defines the volume source (tick or real).
-
Intensity - Bar window used for intensity reference.
-
Bullish Levels (1 to 4) - Scale of green, from lightest to LIME.
-
Bearish Levels (1 to 4) - Red scale, from lightest to RED.
Example of the input parameters screen:
Visual interpretation
-
Bullish Levels
-
Level 1: Very light green (low intensity wave).
-
Level 2: Light green.
-
Level 3: Medium green.
-
Level 4: LIME (maximum intensity bullish wave).
-
-
Bearish Levels
-
Level 1: Very light red (low intensity wave).
-
Level 2: Light red.
-
Level 3: Medium red.
-
Level 4: RED (maximum intensity bearish wave).
-
-
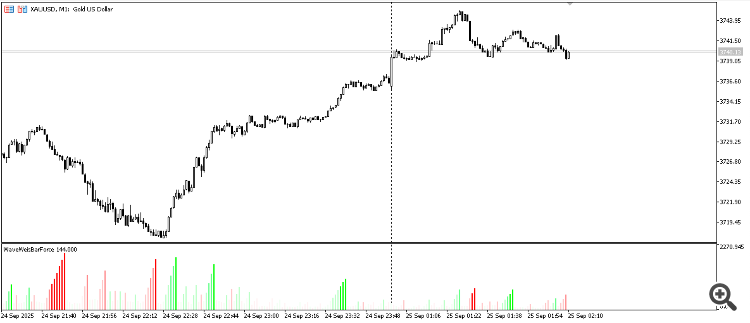
WaveMax (white) - Marks the bar with the highest volume within the current wave.
-
WaveClimax (yellow) - Marks when the current wave's accumulation exceeds the best historical accumulation.
Example of the indicator applied to the chart:
Notes
-
Only the current cumulative value is displayed in the legend.
-
WaveMax and WaveClimax are hidden by default to keep the reading clean.
-
The indicator is suitable for any asset and timeframe, and is especially useful for intraday studies.
64084


