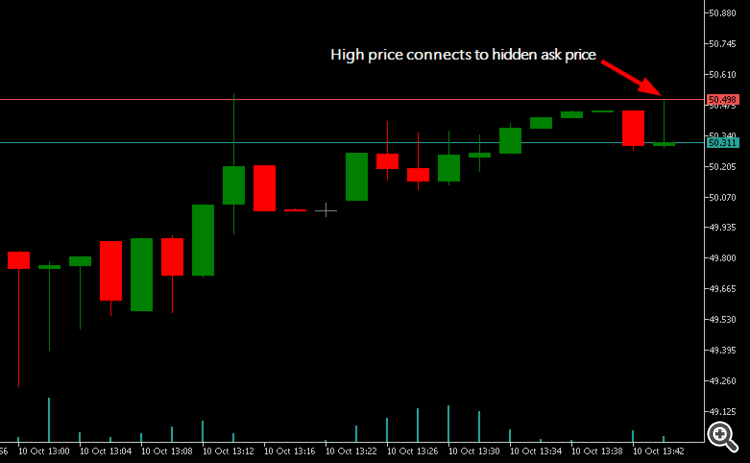
This is a candlestick chart which connects the high of the candle to the ask price if it is currently higher than the current high. The bid price is argued to always be the same as the close price, but it is also included in the logic either way so that the low of the candle connects to the bid price if it is ever lower.
The ask price is always higher than the bid so it makes sense to connect the candles to the ask and bid this way, and it leaves no prices and spreads hidden. The ask line can always be activated on the chart, but ask prices are more tangible if they are seen this way.
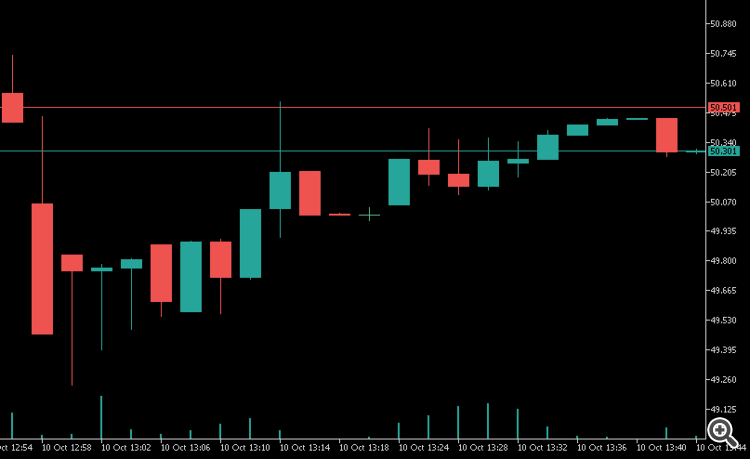
Normal OHLC chart:
OHLC with ask and bid: