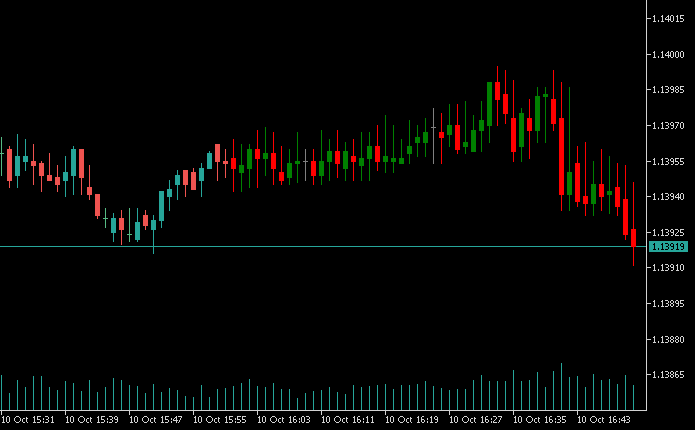
This is another OHLC candlestick chart which finds the highest ask price and lowest bid price on each bar. It uses the high price of the candle to record the highest ask price in that bar (top wick) and uses the low of the candle to record the lowest bid price in that bar (bottom wick).
This way you will see the real tick volatility that is somewhat unapparent on lower timeframes. It could provide insight for where a tight stop loss really needs to be, and where it should not be.
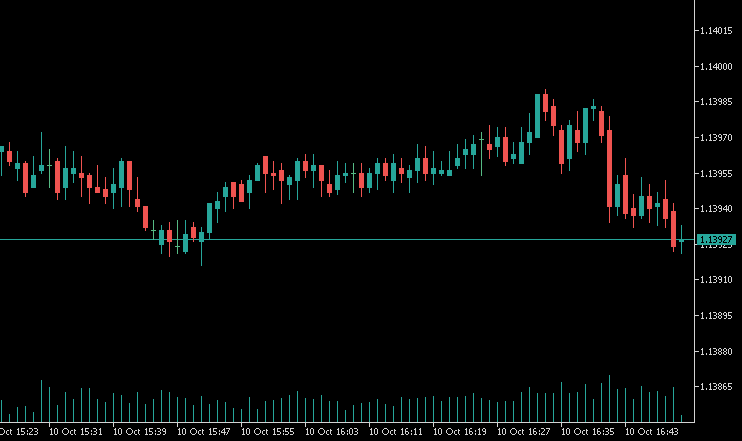
Normal candlestick chart:
OHLC candlestick chart with the highest/lowest tick tracked on each bar