
Real author:
Jordi Bassagañas Galisteo
The problem is measuring the real power of this traditional system based exclusively on MACD.
The EA's rules are as follows:
- Buy when the MACD signal crosses above the waterline line.
- Sell when the MACD signal crosses below the waterline line.
There is also a money management strategy that seeks mathematical expectation by applying a positive risk-benefit ratio which equals or is less than 1.
Settings:
This EA launched the following graphs with the inputs below:
| Expert: | MACDWaterlineCrossExpectator |
| Symbol: | EURUSD |
| Period: | M15 (2012.01.01 - 2012.12.30) |
| Inputs: | pair=EURUSD |
| timeframe=15 | |
| fastEMAPeriod=12 | |
| slowEMAPeriod=26 | |
| signalPeriod=9 | |
| stopLoss=300 | |
| size=0.10000000 | |
| riskBenefitRatio=3 | |
| Broker: | MetaQuotes Software Corp. |
| Currency: | USD |
| Initial Deposit: | 10 000.00 |
| Leverage: | 1:100 |
Image:
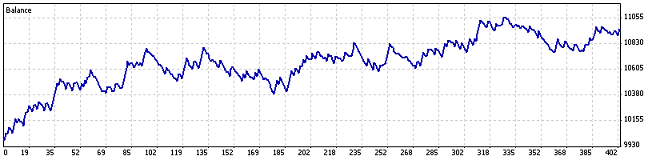
Fig. 1. Balance
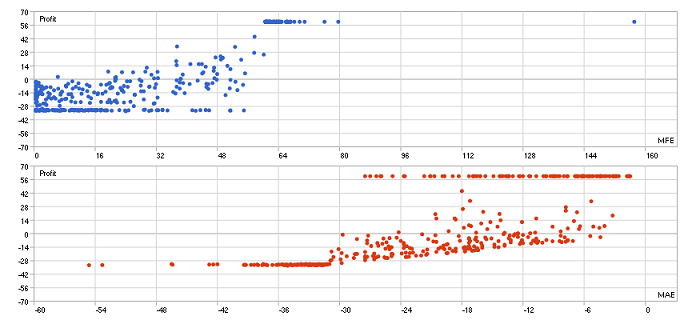
Fig. 2. Correlations
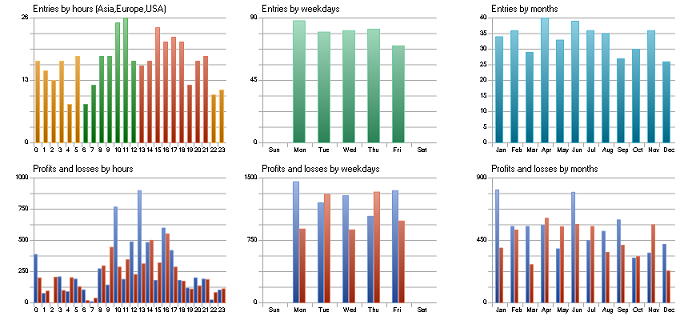
Fig. 3. Entries
Recommendations:
There are many inputs that can be changed when testing MACDWaterlineCrossExpectator, for instance, you can change the risk-benefit ratio, the moving averages periods , the stop loss, etc., and, perhaps the most important, the symbol and the time period in which the robot is run. Please, run your experiments, update the EA's inputs, observe the results obtained and draw your own conclusions.
MACDWaterlineCrossExpectator.mq5 has been developed exclusively for learning purposes, please, use it at your own risk.


