
The classical RVI indicator implemented as a histogram with a color indication of entering the overbought and oversold areas, as well as a colored cloud between the signal line and the oscillator to indicate the oscillator intersections.
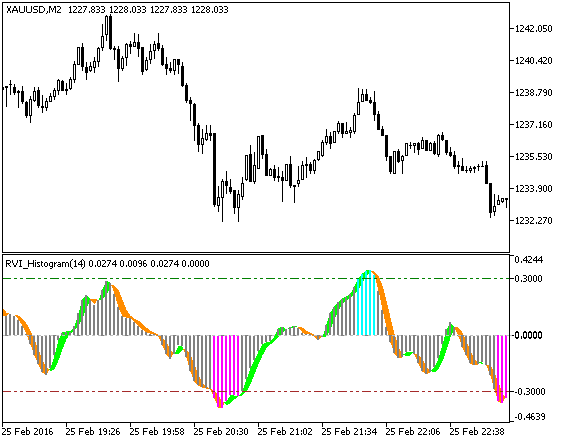
Fig.1. The RVI_Histogram indicator


