As useful RSI is, one property it has is limiting its usefulness - the
"flattening property". With RSI the problem is that the longer the RSI
period is, the flatter the RSI is. It is obvious that same levels are not worth using for both RSIs and that the
lower will almost never reach those levels. It is also obvious that RSI
tends to "work" within certain range of values depending on its length.
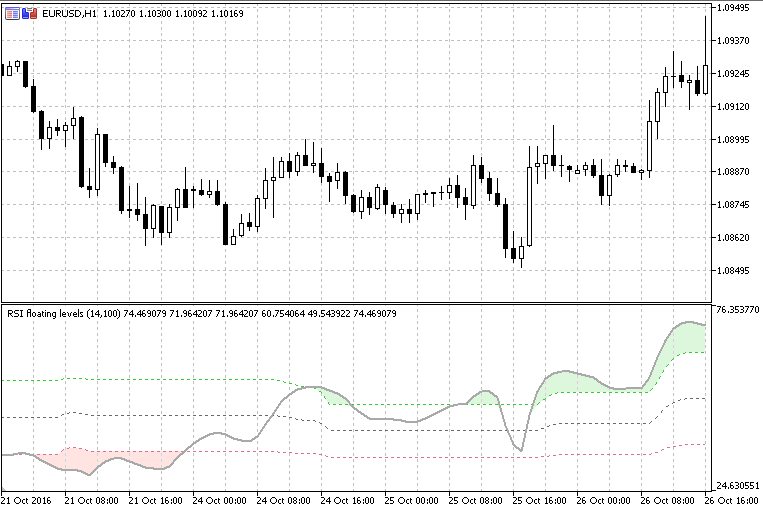
And that is the idea of the attached indicator: to use that range as a
basis for levels and to adapt itself to changes in those ranges to mark
the trading levels.
16768It is obvious that all of a sudden RSI can be a trending indicator
(since even on longer calculating lengths levels are kept at usable
values) and that the problem of flattening is, at least in its bigger
part, solved this way. That way it is giving a bit of a "new life" to
the good old RSI.
Added the filled array for overbought and oversold zones. Also added choices of rsi calculation (the "regular" rsi, Wilder's rsi, rsx
and Cuttler's rsi) as well as jurik smoothing to the rsi value. Just one
additional observation: since the levels are "floating in this one and
since that way the "flattening effect" is avoided in the greatest part
of it, it is interesting to use long rsi periods for calculation too
without losing "signals".