
The indicator displays a symbol price momentum. Pink and green lines are displayed on a chart indicating a market entry direction. Sell if the price breaks through the lower line and buy if it pierces the upper one. The indicator works best on H1 and higher. Support/resistance lines are calculated as local extreme values per the number of bars defined by iPeriod input parameter.
input uint iPeriod=24; //price extremums searching period
The countdown for searching extreme values starts from the bar set in SignalBar.
input uint SignalBar=1; //bar index for searching extremums
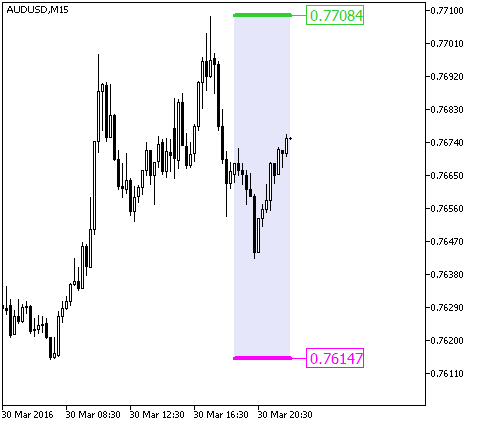
Fig.1. ResSup


