
The Balance of Power (BOP) is an indicator originally developed by Igor Livshin in 2001 to measure the balance of power between buyers and sellers during each candle.
In this version, we've used a Simple Moving Average (SMA) to smooth out the calculation, reducing noise and making it clearer to read.
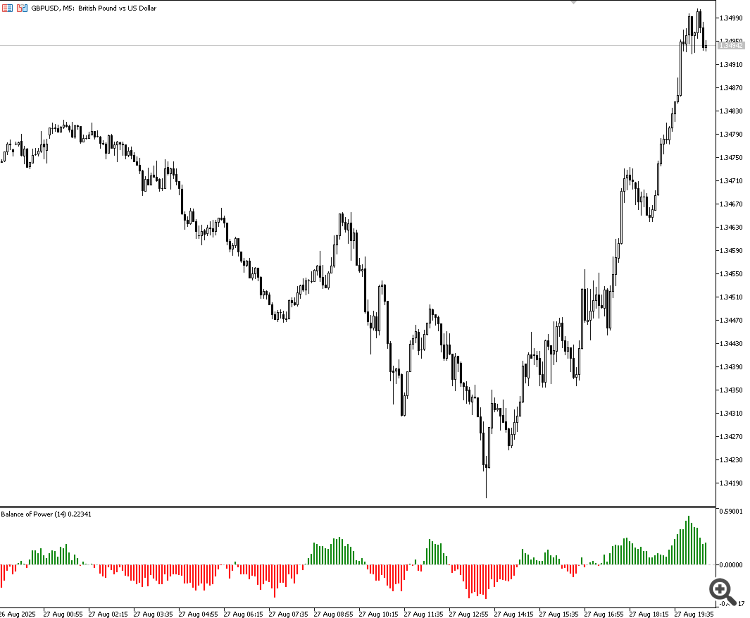
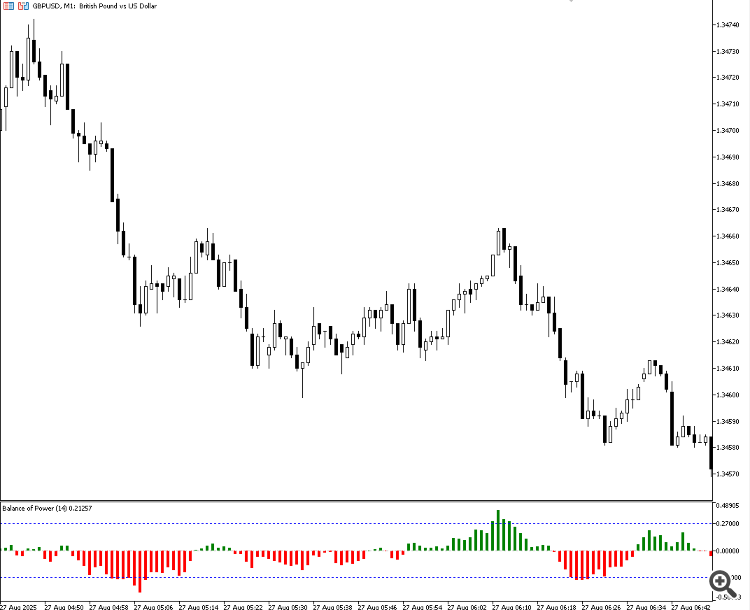
This indicator visually shows who is in control of the market:
-
Buyers (bulls), when the close is close to the high;
-
Sellers (bears), when the close is close to the low.
The basis of the calculation is:
BOP = (Close - Open) / (High - Low)
BOP > 0 - buyer dominance
BOP < 0 - seller dominance
BOP ≈ 0 - balance or indecision
Extreme zones (e.g. ±0.2) - can indicate situations of exaggerated strength that tend towards correction


