
Two colored filled rectangles with the display of channel levels. The rectangles are drawn between the values of two Keltner channels on one bar of any timeframe of the XMA_KLx5_Cloud indicator.
Indicator input parameters:
//+------------------------------------------------+
//|  Indicator input parameters                    |
//+------------------------------------------------+
input ENUM_TIMEFRAMES TimeFrame=PERIOD_H4;     // Chart period
input string Symbols_Sirname="XMA_Keltner_Pivot_";  // Name for the indicator labels
input Smooth_Method XMA_Method=MODE_SMA_;      // Method of averaging
input uint XLength=100;                        // Depth of averaging
input int XPhase=15;                           // First averaging parameter,
3//---- for JJMA within the range of -100 ... +100, it influences the quality of the transition process;
//---- for VIDIA it is a CMO period, for AMA it is a slow average period
input double Ratio1=1.0;                       // Deviation 1
input double Ratio2=3.0;                       // Deviation 2
input Applied_price_ IPC=PRICE_CLOSE_;         // Price constant
input color Up_Color=clrSkyBlue;               // The color of the upper band
input color Middle_Color=clrGray;              // The color of the middle line
input color Dn_Color=clrHotPink;               // The color of the lower band
input uint SignalBar=0;                        // Bar index to get the indicator values
input uint SignalLen=40;                       // The length of the indicator bands
//---- Colors of price labels
input color  Middle_color=clrBlue;
input color  Upper_color1=clrMediumSeaGreen;
input color  Lower_color1=clrRed;
input color  Upper_color2=clrDodgerBlue;
input color  Lower_color2=clrMagenta;
The indicator requires XMA_KLx5_Cloud.mq5 indicator file. Place it in <terminal_data_folder>\MQL5\Indicators.
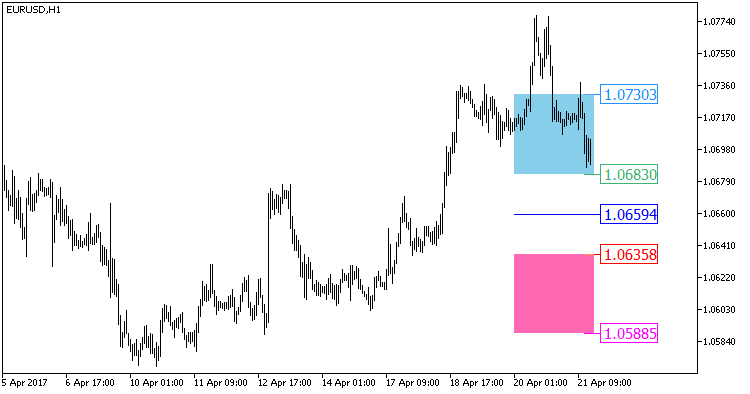
Fig1. The XMA_Keltner_Pivot_HTF indicator


