
The indicator shows on a price chart possible support/resistance levels.
Calculation formula:
Support[i] = 2*Min - Max, Resistance[i] = 2*Max - Min
where
Max, Min - the highest and the lowest price in the range from (i-Period) to (i-1)
The indicator has two input parameters:
- Period - calculation period (* the range for the calculation of maximum and minimum prices);
- Lines length - the length of the Support/Resistance levels.
* The larger the Period, the wider the area between the support line and the resistance line.
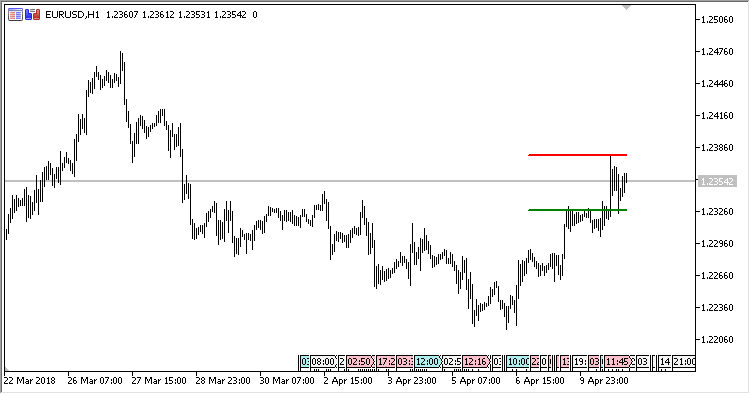
Fig.1. H1, Period = 1
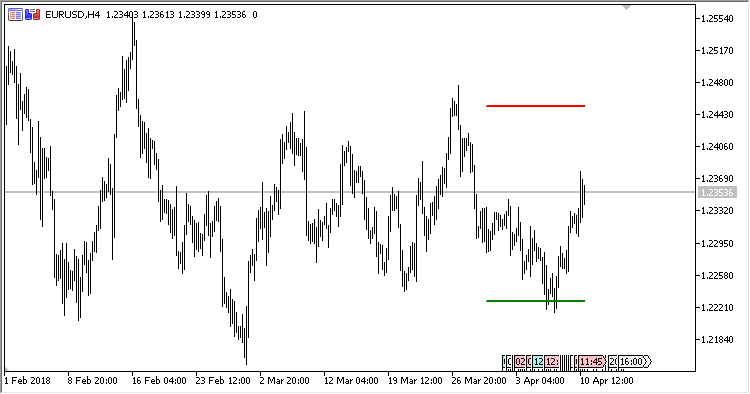
Fig.2. H4, Period = 3
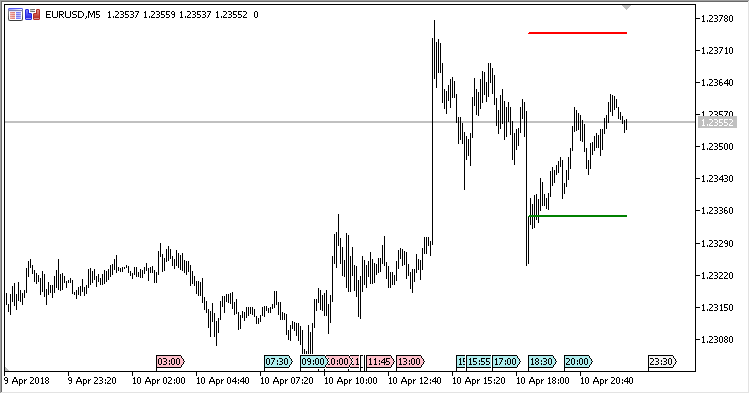
Fig.3. M5, Period = 15 (default)


