
The indicator displays on the chart the Open, High and Low levels of the period specified in parameters.
You can choose between two level display modes:
- High/Low;
- Open/Close.
and two level update modes:
- Only at the opening of the first candlestick of the selected period (showing High, Low and Open of the first candlestick of the specified timeframe);
- Showing levels of the entire period of the specified timeframe.
It also allows setting the period to display levels on the chart.
The indicator has three input parameters:
- Bands period - the period of displayed levels;
- Bands Update - mode for updating levels:
- at the opening of the bar - only the current bar of the selected timeframe is updated, after that levels remain unchanged on all bars of the selected period;
- always - levels are updated when the price exceeds previous levels, i.e. minimum/maximum levels for the whole period are shown.
- Bands Applied price - the open line of the selected period is always displayed, you can choose between two level display modes: the High/Low levels of candlesticks and the Open/Close levels of candlesticks.
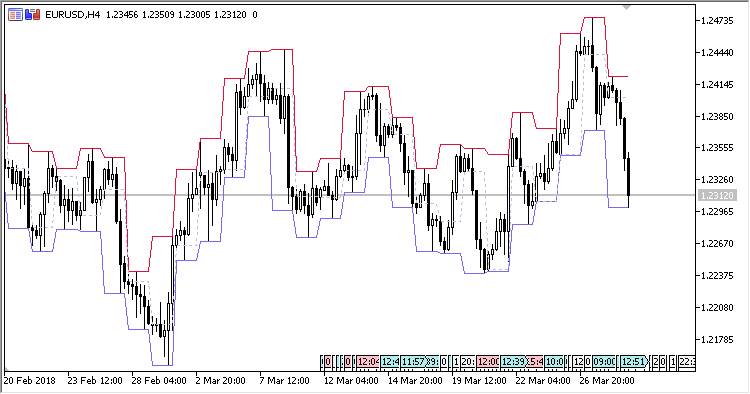
Fig.1. The D1 period on the H4 chart, High/Low levels, update mode "always"
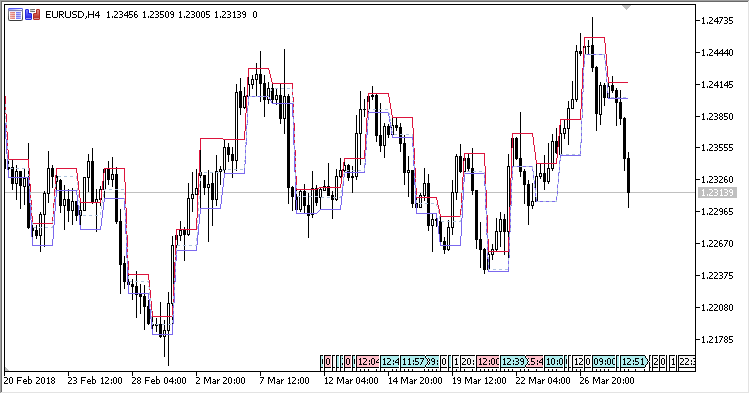
Fig.2. The D1 period on the H4 chart, High/Low levels, update only at the first bar of the period
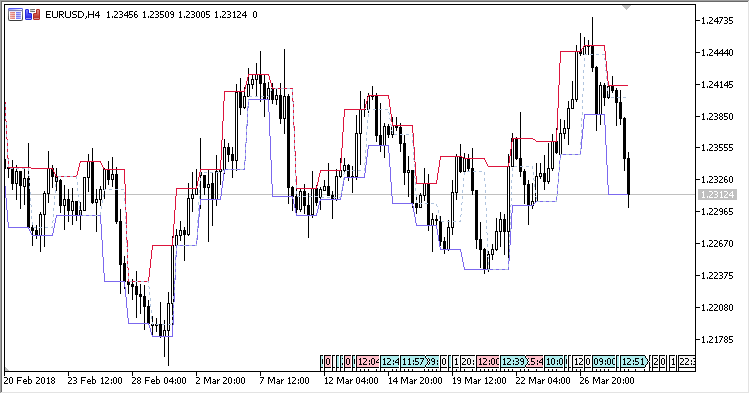
Fig.3. The D1 period on the H4 chart, Open/Close levels, update mode "always"
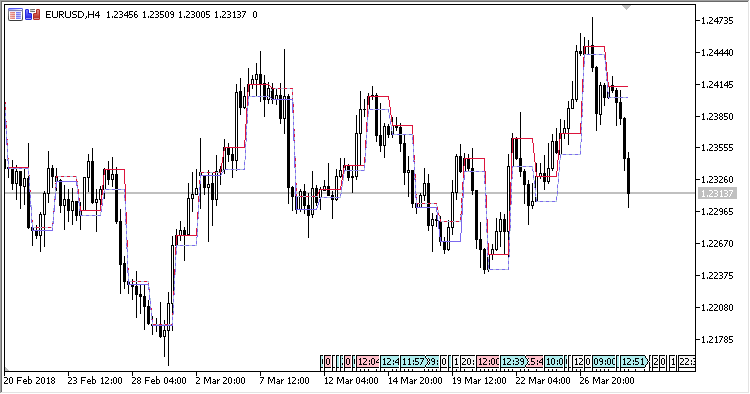
Fig.4. The D1 period on the H4 chart, Open/Close levels, update only at the first bar of the period


