
Interface development of the previous version of the indicator:
+ Automatic tracking of "Market Watch", adding and deleting symbols
+ Automatic rendering of any changes in active symbols
+ Automatic temporary saving of settings when deleting or switching off the terminal
+ Interface: reset, colour theme, mashstabbing, split into bars, minimise, close (deleting from the indicator chart)
OBJECTIVE:
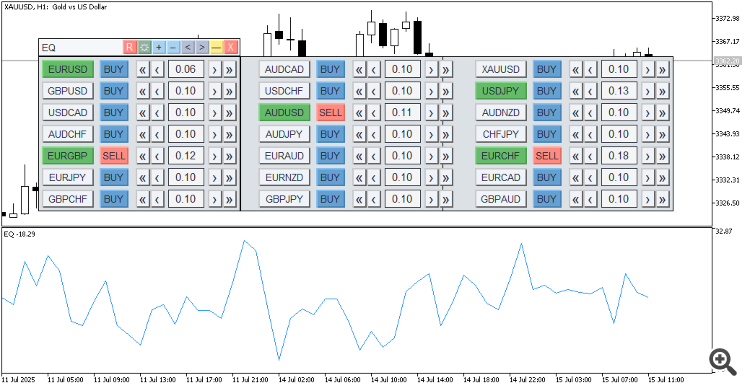
- To identify volatility-flattening constructs for spread/equity trading
- visual analysis of spread trading efficiency
- identification of entry/exit moments for equity trading
- volume and direction are set once for each active pair
- cumulative profit/loss from all positions is calculated
- the result is displayed as an equity line in the subwindow.
- Set volumes, directions and activation of pairs
- Set the depth of the drawing history (in bars)
- Set initial balance (optional)
NOTES:
- spread, commission and swaps are not included in the calculations.
At present, this is an experimental sample on a poorly disclosed technique of profit extraction from spread/equity trading.
There are no definitions, no instructions, knowledge on the subject is fragmentary and contradictory in some places.
I decided to write to understand thesubject.
Currently forum activity on thesubjectis here: https://www.mql5.com/ru/forum/475752
FURTHER STEPS:
.
- Visual analysis of the effectiveness of flat strategies "from channel boundaries": adding optional Bollinger/Converts/Dynamic Levels and others
- Automation of identifying the best (or best) portfolio/basket designs for spread/equity trading, the main thing: finding or creating a suitable formula for this (I'm not good at maths, this is the hardest part).
- Algorithmisation of trading (creation of the EA itself) with favourable results
PS:
Either here or in the https://www.mql5.com/ru/forum/475752 thread, you can share your opinions/knowledge/comments on the topic and on the indicator. Somebody's implementation of the indicator will be even better.


