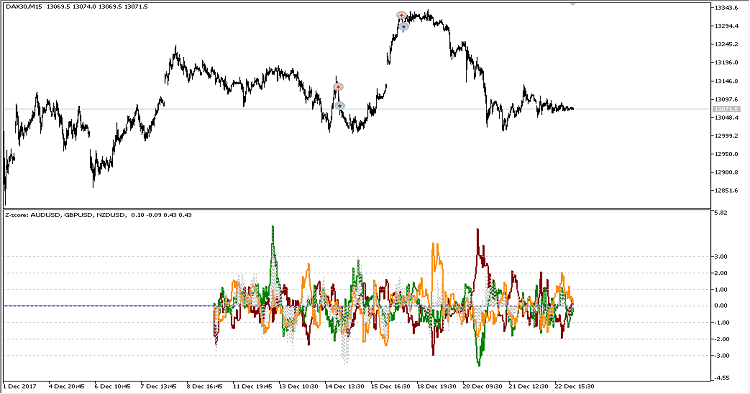
The indicator finds linear regression coefficients between each of the selected symbols and all other symbols, and displays them in the form of standard deviations. The sum of all the curves is displayed as a gray dashed histogram, which shows the deviation of the model portfolio from its real value. It can be used for experimenting with manual or automated pair trading.
Input Parameters
- learning_depth - the calculation period in bars;
- SymbolsList - required symbols separated by commas.