
SuperTrend Indicator – Precise Trend Detection Made Simple
Overview
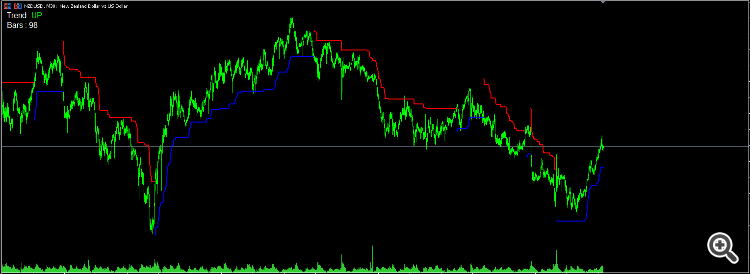
The SuperTrend Indicator is a powerful, easy-to-use tool that overlays directly on your price chart to provide real-time trend direction and high-probability entry/exit signals. Perfect for scalpers, swing traders, and intraday strategies, it dynamically adjusts to market volatility using ATR (Average True Range) and reacts quickly to trend reversals.
Key Features
-
Real-time trend shifts with colored signals
-
Clear buy/sell signals based on price crossing the trend line
-
Built-in smoothing to filter out market noise
-
Works on all timeframes and all instruments (Forex, stocks, crypto, indices)
-
Ideal for both beginners and advanced traders
-
Can be combined with any strategy (EMA, price action, support/resistance)
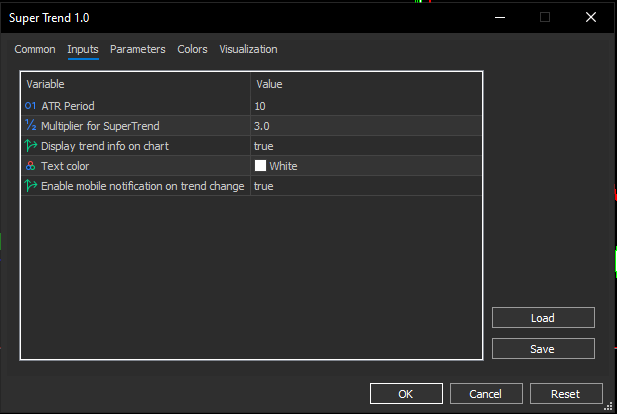
Input Parameters
| Parameter | Description | |
|---|---|---|
| ATR Period | Defines how many bars to calculate the Average True Range. Default: 10 | |
| Multiplier | The factor applied to ATR to offset the SuperTrend line. Default: 3.0 | |
| Price Type | Chooses which price to apply ATR on (e.g., Close, High/Low, etc.) | |
| Line Width | Thickness of the SuperTrend line | |
| Color Settings | Customize uptrend/downtrend colors for better visibility |
How to Use
-
Buy Signal: Price closes above the SuperTrend line → trend is bullish
-
Sell Signal: Price closes below the SuperTrend line → trend is bearish
-
Combine with other confirmations for best results (e.g., RSI, EMA, candlestick patterns)
Best Practices
-
Use on H1 or higher for cleaner trend detection
-
Add ATR or Volume indicators for additional context
-
Use as confirmation in a multi-indicator strategy or standalone for trend-following
Take Your Trading to the Next Level
The SuperTrend Indicator helps you stay on the right side of the market and reduce noise. Whether you trade breakouts, trends, or pullbacks, this tool brings clarity and precision to your charts.


