
Indicator Stochastic Overlay displays the chart as colored candles in accordance with the data of oscillator Stochastic.
It has eight adjustable parameters:
- Data Stochastic Compare mode - Stochastic data comparison mode
- Stochastic's main and signal lines - Stochastic main line and signal line
- Stochastic vs level 50 - Stochastic line as referred to level 50
- Current and previous stochastic values - comparing the current and previous values of the Stochastic line
- Stochastic vs OB/OS levels - Stochastic line as referred to the overbought/oversold levels
- Stochastic %K period - Stochastic %K line calculation period
- Stochastic %D period - Stochastic %D line calculation period
- Stochastic slowing - Stochastic slowing calculation period
- Stochastic price field - Stochastic calculation prices
- Stochastic method - Stochastic calculation method
- Stochastic overbought - Stochastic overbought level
- Stochastic oversold - Stochastic oversold level
Stochastic's main and signal lines:
- If the main line of Stochastic is above the signal line,
then the bullish candle is displayed in green
the bearish candle is displayed in light-green
- If the main line of Stochastic is below the signal line,
then the bearish candle is displayed in red
the bullish candle is displayed in light-red
- In all other cases, the candle is gray
Stochastic vs level 50:
- If the line of Stochastic is above level 50,
then the bullish candle is displayed in green
the bearish candle is displayed in light-green
- If the line of Stochastic is below level 50,
then the bearish candle is displayed in red
the bullish candle is displayed in light-red
- In all other cases, the candle is gray
Current and previous stochastic values:
- If the main line values of Stochastic grow,
then the bullish candle is displayed in green
the bearish candle is displayed in light-green
- If the main line values of Stochastic fall,
then the bearish candle is displayed in red
the bullish candle is displayed in light-red
- In all other cases, the candle is gray
Stochastic vs OB/OS levels:
- If the main line of Stochastic is above the overbought level,
then the bullish candle is displayed in green
the bearish candle is displayed in light-green
- If the main line of Stochastic is below the oversold level,
then the bearish candle is displayed in red
the bullish candle is displayed in light-red
- In all other cases, the candle is gray
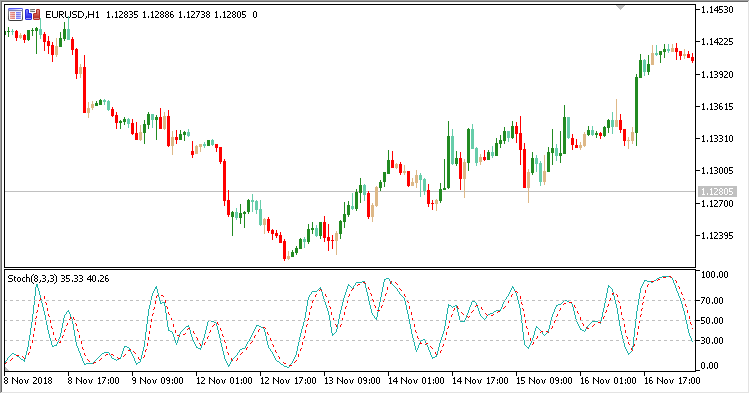
Fig. 1. Stochastic Overlay + Stochastic. Data Stochastic Compare mode = Stochastic's main and signal lines
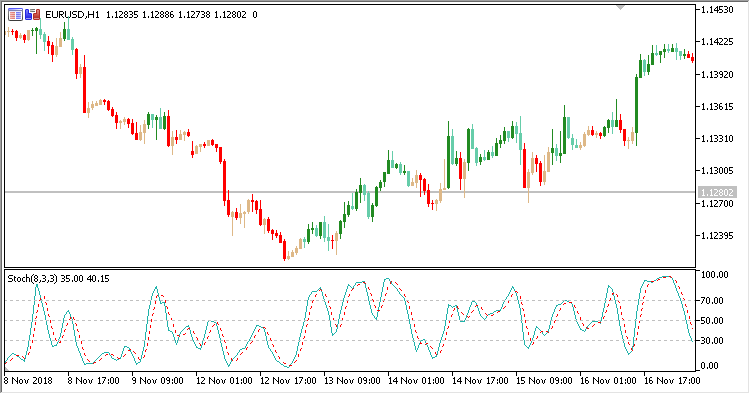
Fig. 2. Stochastic Overlay + Stochastic. Data Stochastic Compare mode = Stochastic vs level 50
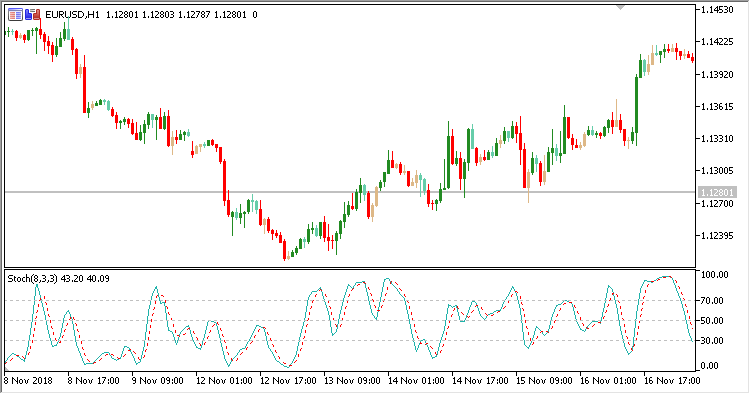
Fig. 3. Stochastic Overlay + Stochastic. Data Stochastic Compare mode = Current and previous stochastic values
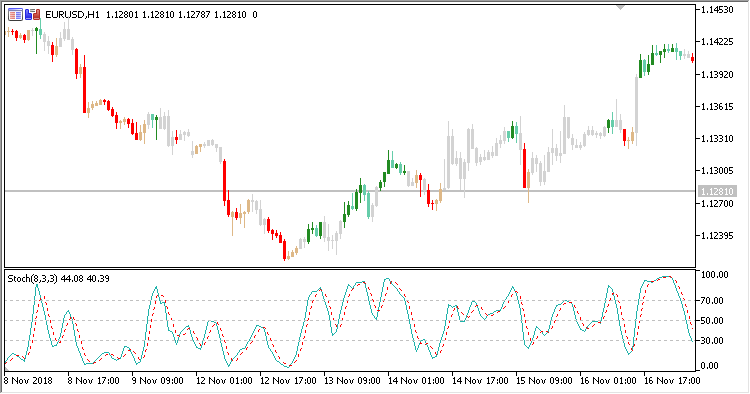
Fig. 4. Stochastic Overlay + Stochastic. Data Stochastic Compare mode = Stochastic vs OB/OS levels


