
Projection_Oscillator is based on Projection_Bands. Unlike the original indicator, it displays the line in a separate window with overbought/oversold levels.
The indicator has three input parameters:
- Period - calculation period;
- Overbought - overbought level;
- Oversold - oversold level.
Calculation:
PO = 100 * (Close-DnBand) / (UpBand-DnBand) UpBand = Max(High, PrevHigh*SlopeHigh) DnBand = Min(Low, PrevLow*SlopeLow)
where:
- SlopeHigh - regression line slope of High prices in the Period range;
- SlopeLow - regression line slope of Low prices in the Period range.
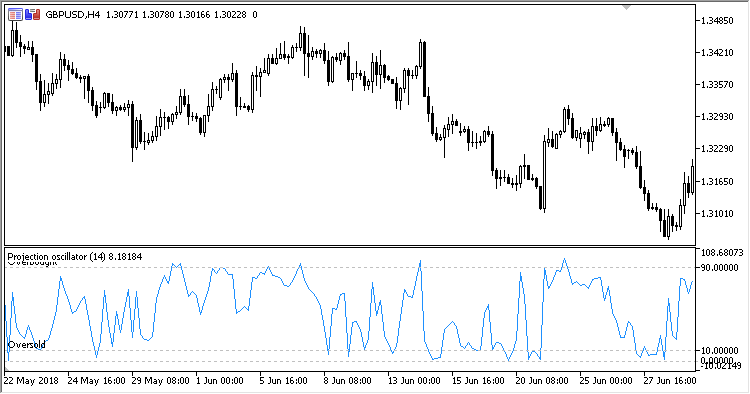
Fig. 1. Projection Oscillator
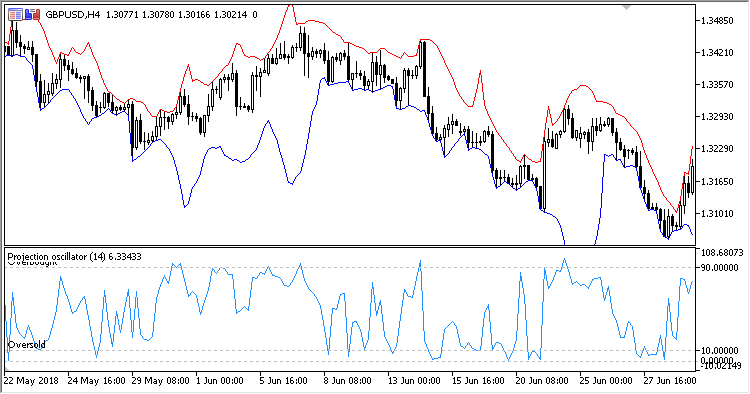
Fig. 2. Projection Oscillator + Projection Bands


