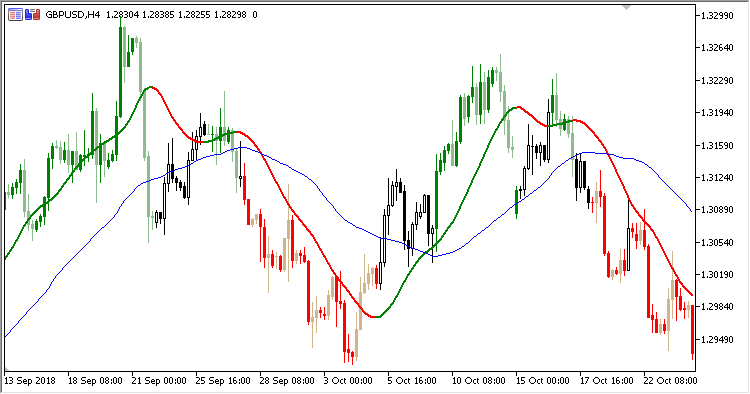
Trend indicator. The indicator displays the lines and compares direction of two moving averages: Moving Average and Slope Direction Line. If the indicator lines coincide, the price chart displays colored candles.
It has six input parameters:
- MA period - Moving Average calculation period
- MA method - Moving Average calculation method
- MA applied price - Moving Average calculation price
- SDL period - Slope Direction Line calculation period
- SDL method - Slope Direction Line calculation method
- SDL applied price - Slope Direction Line calculation price
- If Moving Average and Slope Direction Line are directed upwards:
- If the candle is bullish, it is colored in green.
- If the candle is bearish, it is colored in light-green
- If Moving Average and Slope Direction Line are directed downwards:
- If the candle is bearish, it is colored in red.
- If the candle is bullish, it is colored in light-red
- In any other case, colored candles are not drawn.