
Vortex Trend signal indicator. The indicator is based on Vortex indicator. It displays the colored diagram of the trend direction in a separate chart window.
There are five inputs:
- Vortex period - Vortex indicator calculation period
- Upper limit of the filtering range
- Lower limit of the filtering range
- Use Vortex smoothing - use smoothing of Vortex lines (Yes/No)
- Smoothing - Vortex indicator lines smoothing period
- Bullish trend (green signal pointers)
When the line +VI of Vortex indicator exceeds Upper limit of the filtering range (default is 110) and
When the line -VI of Vortex indicator is less than Lower limit of the filtering range (default is 90)
- Bearish trend (red signal pointers)
When the line -VI of Vortex indicator exceeds Upper limit of the filtering range (default is 110) and
When the line +VI of Vortex indicator is less than Lower limit of the filtering range (default is 90)
- In any other cases, it is considered that there is no trend (gray warning pointers)
If smoothing is enabled (Use Vortex smoothing = Yes), the indicator's smoothed SMA lines with 'Smoothing' period are taken into account.
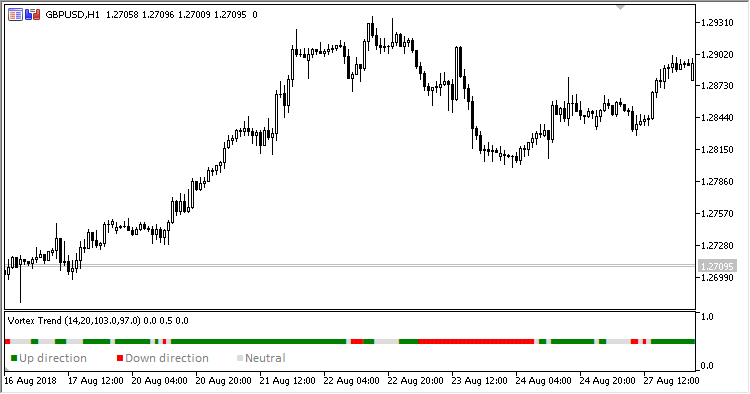
Fig. 1. Vortex Trend
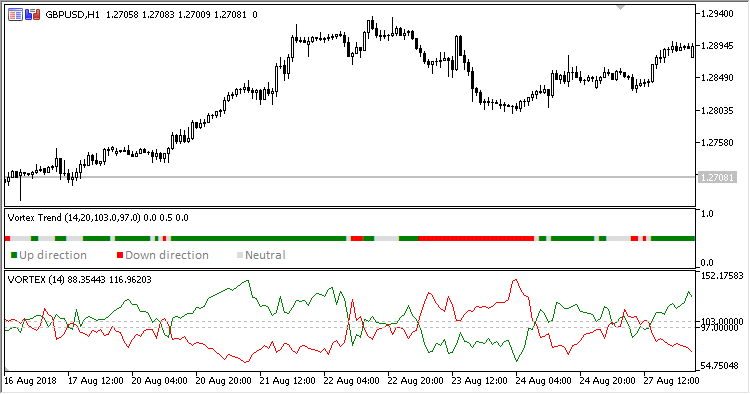
Fig. 2. Vortex Trend + Vortex


