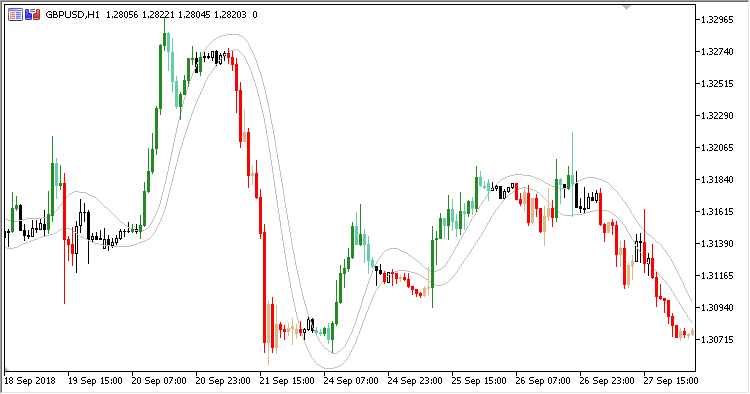
T3 Price Overlay indicator displays two T3 MAs calculated by High and Low prices and colored candles extending beyond the moving average lines.
It has two configurable parameters:
- T3 period - T3 MA calculation period
- T3 volume factor - T3 volume ratio
The presence of T3 MA is not required - its calculation is implemented inside the indicator.
- When the price of the Close candle is located above the upper T3 MA line, i.e. the candle is bullish, it is colored green, if the candle is bearish, it is colored light-green.
- When the Close candle price is below the T3 MA lower line and the price is bearish, it is colored red, if the candle is bullish, it is colored light-red.