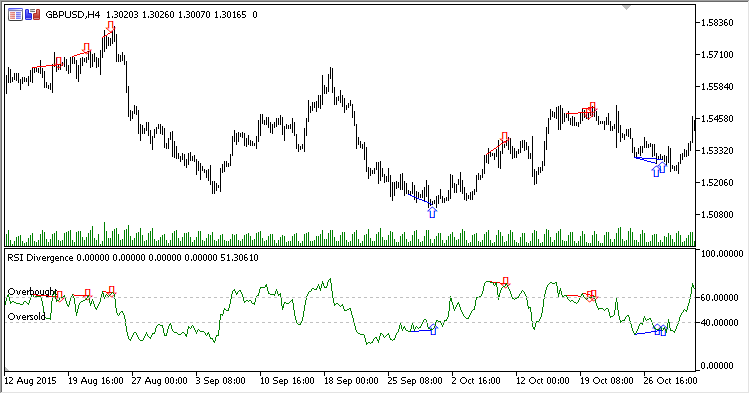
RSI Divergence draws the RSI indicator line in a separate window and displays found divergences in the indicator window and on the price chart.
It has six input parameters:
- Period - calculation period
- Applied price
- Overbought - overbought level
- Oversold - oversold level
- Bullish color - color of bullish signal arrows and lines
- Bearish color - color of bearish signal arrows and lines
Divergences are detected only on segments where RSI line is above/below overbought/oversold levels.