
Like Deviation from MA, the indicator displays values of maximum deviation between MA and the price. However, unlike Deviation from MA, it uses a colored histogram in a separate window.
Frames are used to detect maximum values (as when searching for fractals).
22601 Frames are used to detect maximum values (as when searching for fractals).
It has four inputs:
- Period - МА calculation period
- Method - МА calculation method
- Applied price - МА calculation price
- Frames - size of one frame, within which the search for a maximum deviation is performed
Detected maximum deviations within a frame are marked with colored histogram columns:
- maximum deviation downwards from МА is marked in blue
- maximum deviation upwards from МА is marked in red.
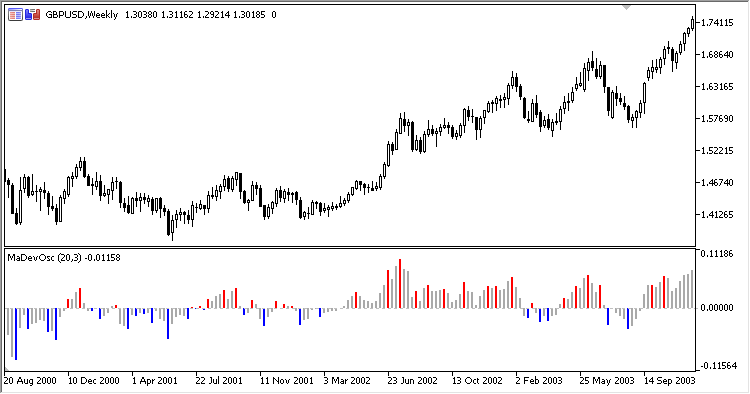
Fig. 1. Deviation from MA oscillator
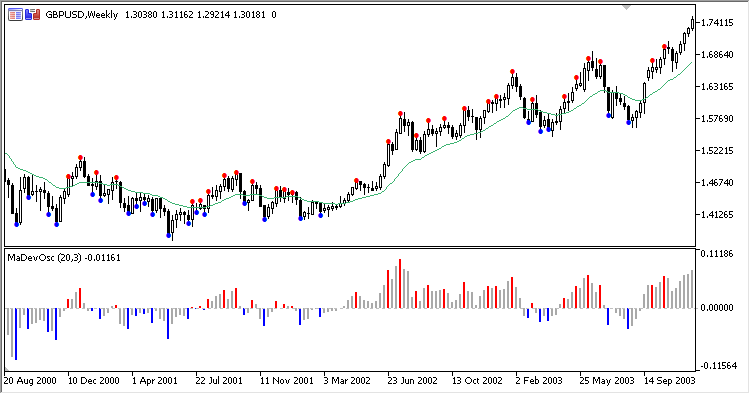
Fig. 2. Deviation from MA oscillator + Deviation from MA


