
The indicator shows in the price chart the lowest top and the highest bottom over the last N periods. You can also use it to enable displaying the highest top and the lowest bottom.
It has three input parameters:
- Reverse period - period for calculating the highest bottom and the lowest top;
- Show Min/Max lines - switch to display levels Min/Max (Yes/No);
- Min/Max period - periof for calculating the Min/Max of the highest bottom and the lowest top.
Calculations:
ReverseMin[i] = Low[HL] ReverseMax[i] = High[LH] Min[i] = Low[LL] Max[i] = High[HH]
where:
- HL - the highest bottom index over the Reverse period;
- LH - the lowest top index over the период Reverse period;
- HH - the highest top index over the Min/Max period;
- LL - the lowest bottom index over the Min/Max period.
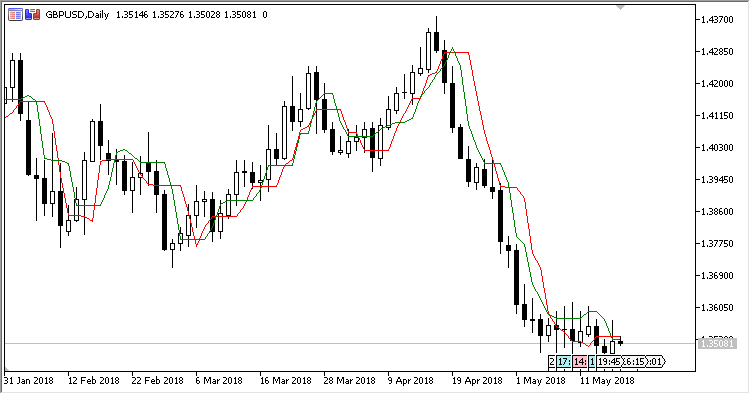
Fig.1 Displaying the highest Max and the lowest Min is disabled (by default)
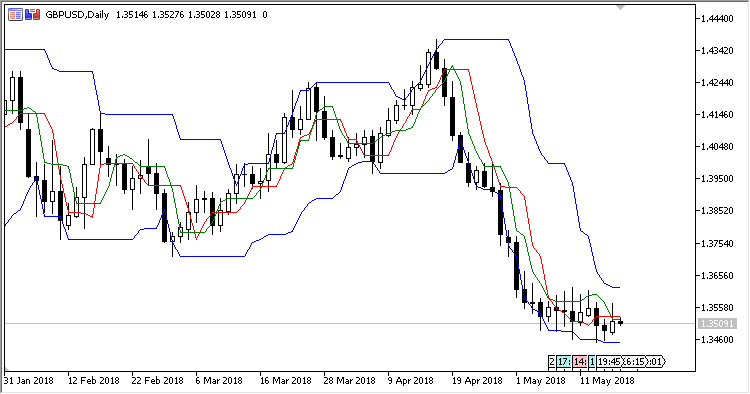
Fig.2 Displaying the highest Max and the lowest Min is enabled


