
The "Multi Time Frame Power Weighted Moving Average" indicator shows the power-weighted moving average value of different timeframes. data of three PWMAs of different timeframes are displayed on the price chart.
It has six input parameters:
- Period - calculation period
- Power
- Drawing mode - indicator drawing type
- Steps - as a ladder
- Slope - sloping lines
- First PWMA timeframe - the timeframe of the first PWMA
- Second PWMA timeframe - the timeframe of the second PWMA
- Third PWMA timeframe - the timeframe of the third PWMA
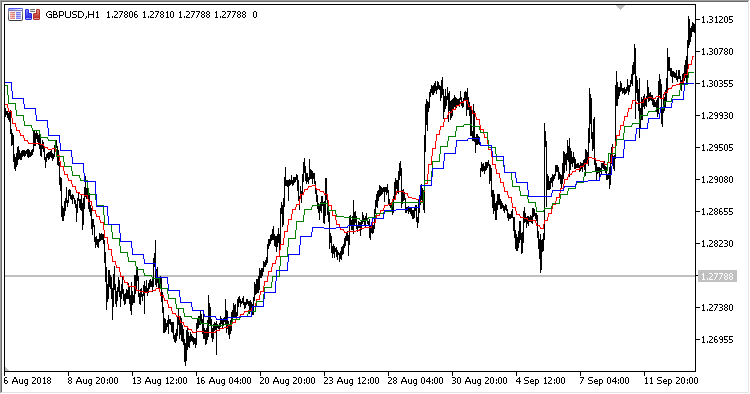
Fig.1. Multi Time Frame Power Weighted Moving Average; H4, H8 and H12 data on the H1 chart, Drawing mode = Steps
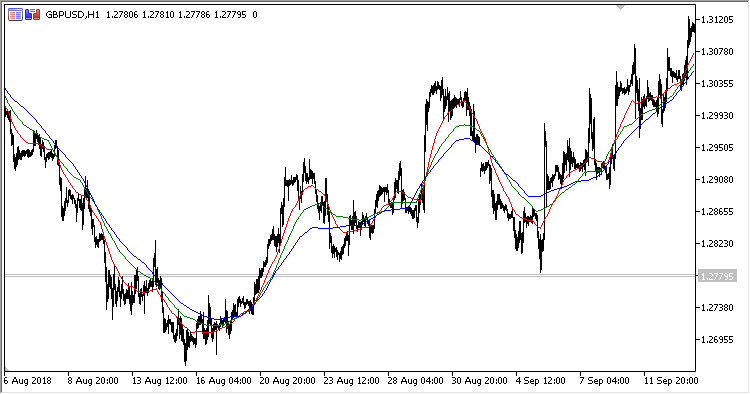
Fig.2. Multi Time Frame Power Weighted Moving Average; H4, H8 and H12 data on the H1 chart, Drawing mode = Slope


