
The "Multi timeframes RSI" oscillator shows data of three RSI indicators from different timeframes on the current one.
It has seven input parameters:
- RSI period - RSI calculation period
- Overbought - overbought level
- Oversold - oversold level
- Drawing mode - indicator drawing type
- Steps - as a ladder
- Slope - sloping lines
- First RSI timeframe - the timeframe of the first RSI
- Second RSI timeframe - the timeframe of the second RSI
- Third RSI timeframe - the timeframe of the third RSI
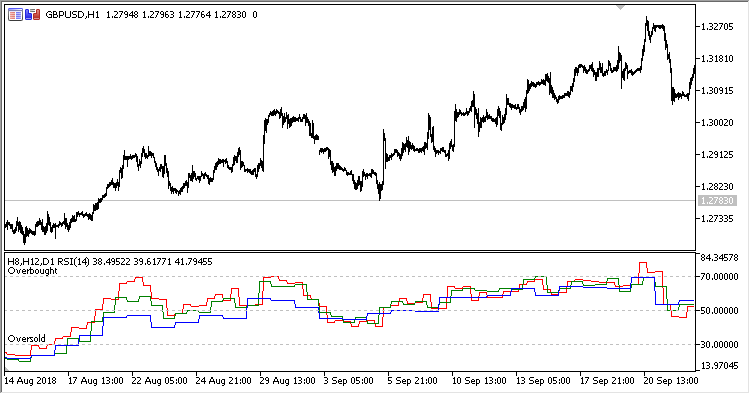
Fig.1. Multi timeframes RSI, H8, H12 and D1 data on the H1 chart, Drawing mode = Steps
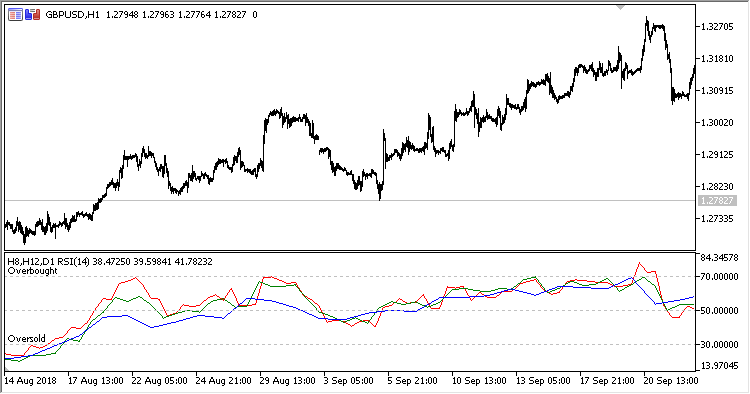
Fig.2. Multi timeframes RSI, H8, H12 and D1 data on the H1 chart, Drawing mode = Slope


