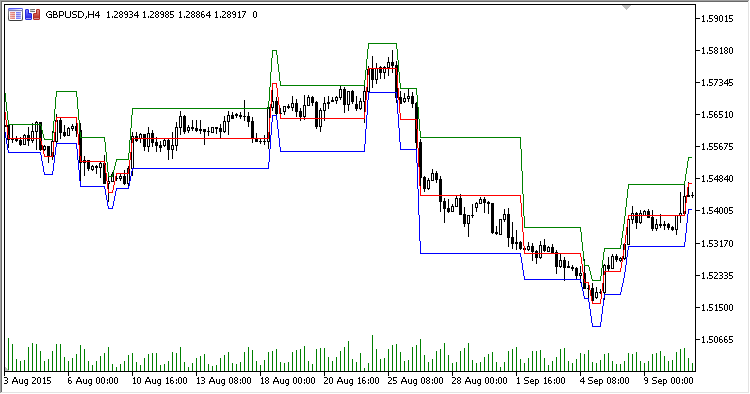
Mogalef Bands developed by Eric Lefort consist of three lines: central (theoretical middle of the trading corridor, i.e. weighted average price level, lower (the same, but at the lowest prices), and the upper line (built by the maximum prices). Thus, a trading corridor is formed.
22089 The author believes that in most cases, the price tends to return back to the corridor after leaving it. Then it heads to the central line.
Unlike the author's calculation, the upper and lower lines of the corridor are calculated using the standard deviation.
The indicator has three input parameters:
- Linear regression period - linear regression period for calculating the central line of the channel
- Standard deviation period - standard deviation period for calculating extreme channel lines
- Multiplier - multiplier for calculating the channel width
Calculation:
Central = LinearReg((Open+High+Low+(2*Close))/5) Top Band = Central + Multiplier * Deviation Bottom Band = Central - Multiplier * Deviation
where:
Deviation = StdDev(Close,Standard deviation period,SMA)
- If Central < PrevTop && Central > PrevBottom
Top = PrevTop Central = PrevCentral Bottom = PrevBottom