
KDJ Averages oscillator defines when it is necessary to search for market entry conditions. Unlike KDJ, it is calculated using standard smoothing methods. In case of the default settings, its J line is slightly faster.
It has six input parameters:
- KDJ period - KDJ indicator calculation period;
- K period - K line calculation period;
- K method - K line calculation method;
- D period - D line calculation period;
- D method - D line calculation method;
- Threshold - signal line.
Calculation:
K = MA(RSV, KPeriod, KMethod) D = MA(K, DPeriod, DMethod) J = 3.0*D - 2.0*K
where:
RSV = ((Close – Lowest Low) / (Highest high – Lowest low)) * 100
Lowest Low, Highest High - the lowest and highest prices within the Period interval.
Possible interpretation options: J line crossing the Threshold level. Up - search the possibility for selling, down - search for the appropriate moment to buy.
After J line crosses the Threshold level, wait till J line is crossed by K and D lines. Crossing direction = market entry direction.
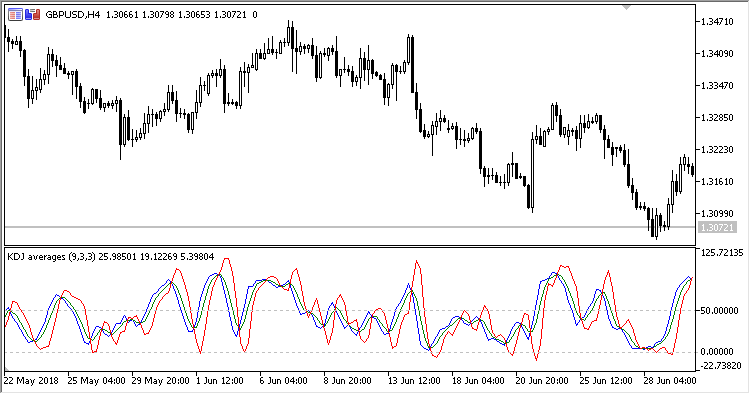
Fig. 1. KDJ Averages
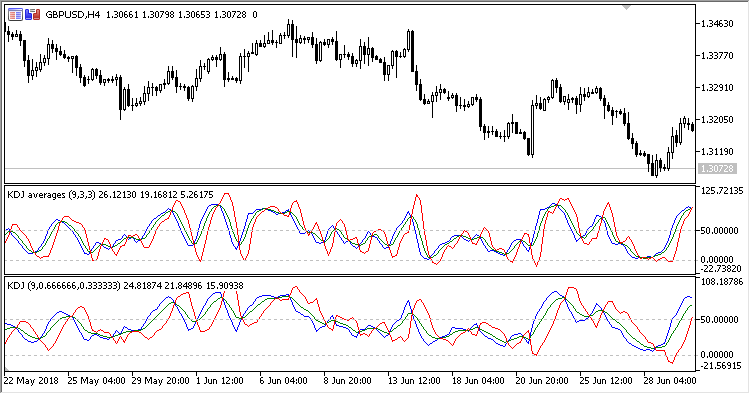
Fig. 2. KDJ Averages compared with KDJ


