Fractal Graph Dimension Indicator shows the market state: trend or volatility.
It was described in "Technical Analysis of Stocks and Commodities" in March, 2007, in the article by Radha Panini, based on the article "A procedure to Estimate the Fractal Dimension of Waveforms" by Carlos Sevcik.
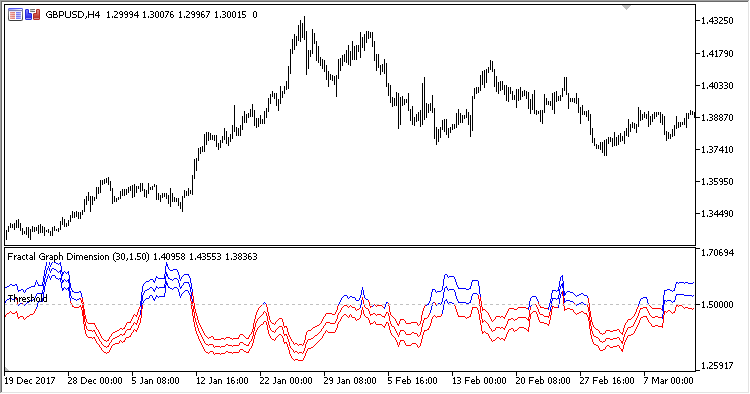
The indicator has three input parameters:
- Period - calculation period
- Applied price
- Threshold - the threshold level
Values below the threshold mean the trend state of the market and are displayed in red. Values above the threshold indicate the unstable volatile state and are displayed in blue.