
Features:
- Overlay candles from any past date directly onto the current chart.
- Automatic adjustment of replay zone/magnifier to match live chart movement.
- Dynamic tooltips showing:
- Time.
- Open, High, Low, Close.
- Candle Range.
- Bullish/Bearish direction.
- Volume.
- Customizable colors for bullish/bearish candles and zones.
- Interactive zone for selecting and dragging overlay region.
- Works on intraday timeframes (e.g. M1 to H1).
Parameters:
| Parameter Name | Description |
|---|---|
| InpReplayDate | Date to fetch historical candles from. |
| InpMainZoneColor | Color for the main live zone rectangle. |
| InpReplayZoneColor | Color for the replay overlay zone. |
| InpBullColor | Color for bullish replay candles. |
| InpBearColor | Color for bearish replay candles. |
How to Use:
A simple step-by-step guide:
- Attach the indicator to a chart (preferable intraday).
- Select the Replay Date using input panel.
- The indicator will draw a red "Main Zone" on your current chart.
- A green "Replay Zone" will display historical candles mapped to the same relative position and size.
- Hover over the replay bars to see candle details.
What's inside the Zones?
- The first candle in the Main Zone (on the left) corresponds to the first candle from the selected ReplayDate.
- The current live candle (on the right of the red zone) is aligned with the last candle of the green Replay Zone.
- This lets you easily see:
- "How did the market behave at this position last time?".
- "Are we repeating a similar pattern?".
What's around my current Candlestick?
- The current candlestick (last bar in the red Main Zone) corresponds exactly to the last candle in the green Replay Zone - they are aligned in both time position and open price.
- The first candle on the left of the Main Zone is matched to the first candle of the Replay Zone (from the selected ReplayDate).
- The last (current) candle of the Main Zone is matched to the last candle from the Replay Zone - their opening prices are identical for comparison.
- This lets you answer:
- "What did price do next the last time we were at the same level and time of day?".
Notes and Limitations:
- Zone Range: Large replay ranges may impact performance on low-end devices.
- No Wicks: Only candle bodies are drawn, upper and lower shadows are not shown.
- No buffers: This indicator uses only chart objects (rectangles), not indicator buffers.
- Redraws every new bar: The full replay zone is re-rendered on each new tick or bar, which is not optimized for performance.
- Market Closed on Replay date: If the market was closed on the selected ReplayDate, no candles will appear.
- Replay Offset Risk: If some bars are missing on the replay date, the green replay zone may misalign, and the current candle's open price may not match the replay candles open price.
- Only intraday timeframes supported: This tool is designed for intraday use (below daily timeframe). Not intended for D1/W1/M1.
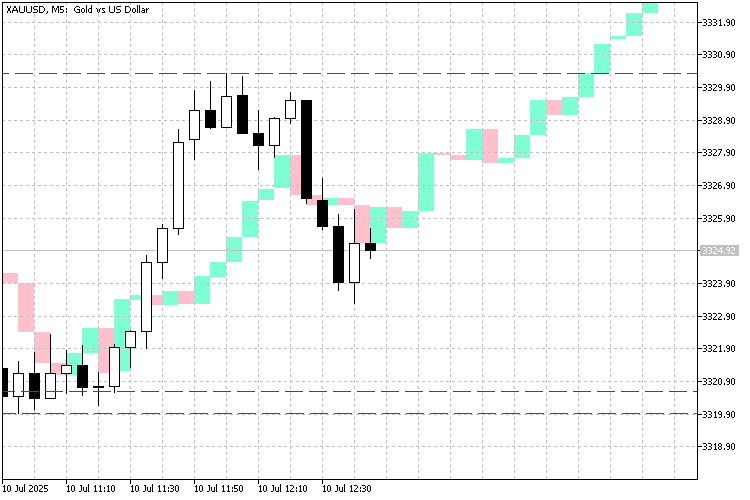
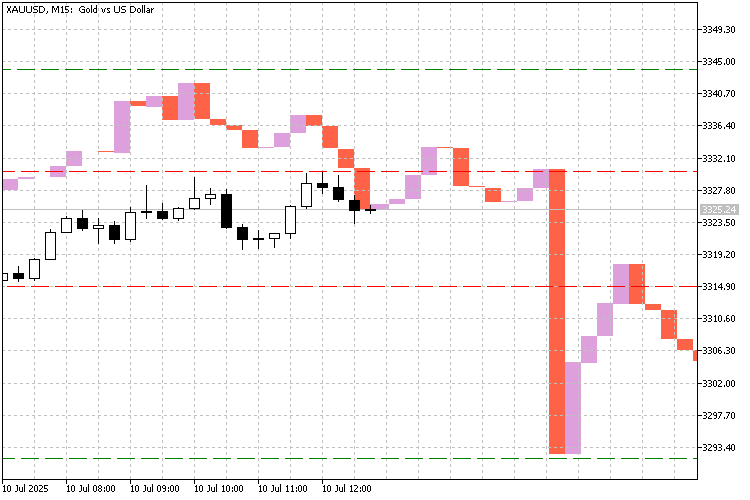
Screenshots:
Conclusion:
Whether you're a pattern trader, scalper, or just want to visually compare market behavior, this tool adds a new perspective to your analysis. Give it a try and let me know what you think!


