
Bigger Time Frame Bollinger Bands displays Bolinger Bands indicator data of a higher timeframe on the current one.
The indicator has nine adjustable parameters:
- BB period - Bollinger Bands calculation period
- BB deviation - Bollinger Bands deviation value
- BB applied price - Bollinger Bands calculation price
- BB timeframe - displayed Bollinger Bands timeframe
- Drawing mode - indicator drawing type
- Steps - as a ladder
- Slope - inclined lines connecting two neighboring bars of the calculation timeframe
- Show middle lines - show the Bollinger Bands middle line (Yes/No)
- Show alerts - whether to enable alerts (Yes/No)
- Send mails - whether to notify by email (Yes/No)
- Send push-notifications - whether to send push notifications (Yes/No)
Signals are generated when the current Close price moves beyond the upper and lower Bollinger Bands
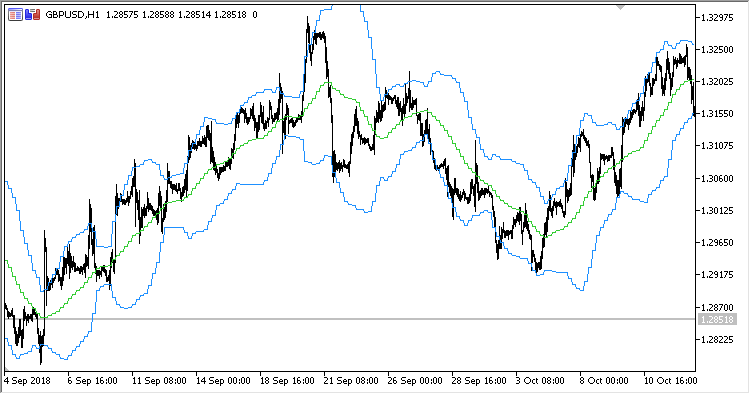
Fig.1. Bigger Time Frame Bollinger Bands, H4 data on the H1 chart, Drawing mode = Steps
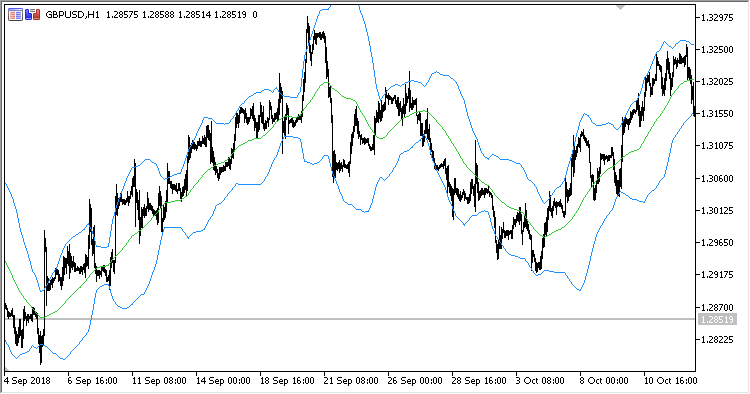
Fig.2. Bigger Time Frame Bollinger Bands, H4 data on the H1 chart, Drawing mode = Slope
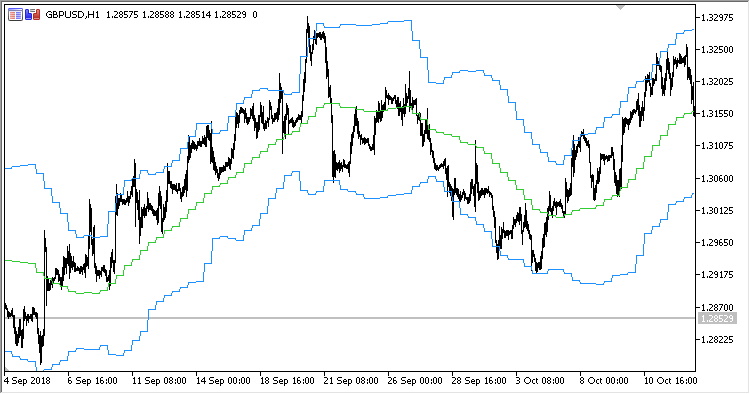
Fig.3. Bigger Time Frame Bollinger Bands, H8 data on the H1 chart, Drawing mode = Steps

Fig.4. Bigger Time Frame Bollinger Bands, H8 data on the H1 chart, Drawing mode = Slope


