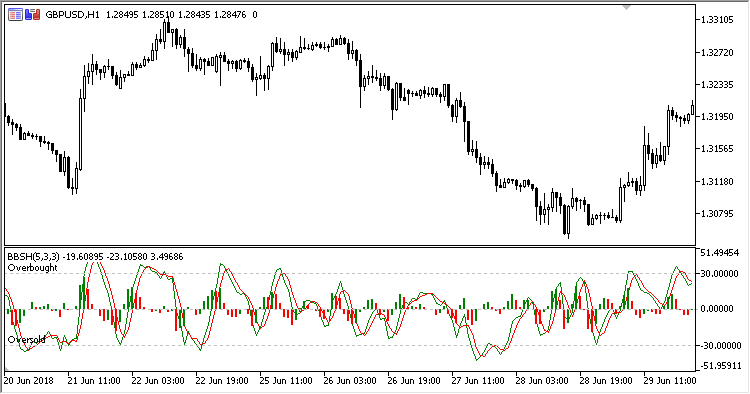
Bar Based Stochastic indicator with histogram - modified stochastic with the K and D lines difference histogram.
The indicator has nine adjustable parameters:
- %K period - stochastic K line period
- %D period - stochastic D line period
- Slowing - slowing
- %K method - stochastic K line calculation method
- %D method - stochastic %D line calculation method
- Overbought - overbought level
- Oversold - oversold level
- Show %K line - display K line (Yes/No)
- Show %D line - display D line (Yes/No)
Calculation:
K = MA(FastK, Slowing, %K method) D = MA(K, %D period, %D method) H = K - D
where:
FastK = 100.0 * mins/maxes mins = Close - minLow maxes = maxHigh - minLow minLow, maxHigh - low and high prices in the %K period range H - histogram