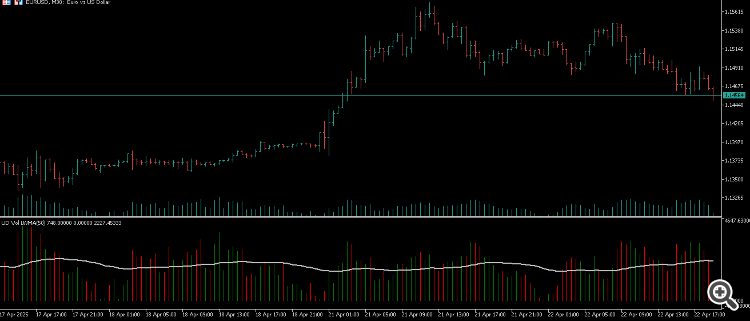
It's a classic indicator which plots a moving average on volume (tick volume) instead of price. The histogram bars that describe the volume are coloured based on the price bars.
It's an MQL4 conversion and the original old code can be found here: https://www.mql5.com/en/code/25462
Tick volume breaking above the moving average could indicate increased participation - signalling strong trends or volatile movements.
Tick volume staying below the moving average might suggest lower liquidity, meaning the market is quieter or consolidating.