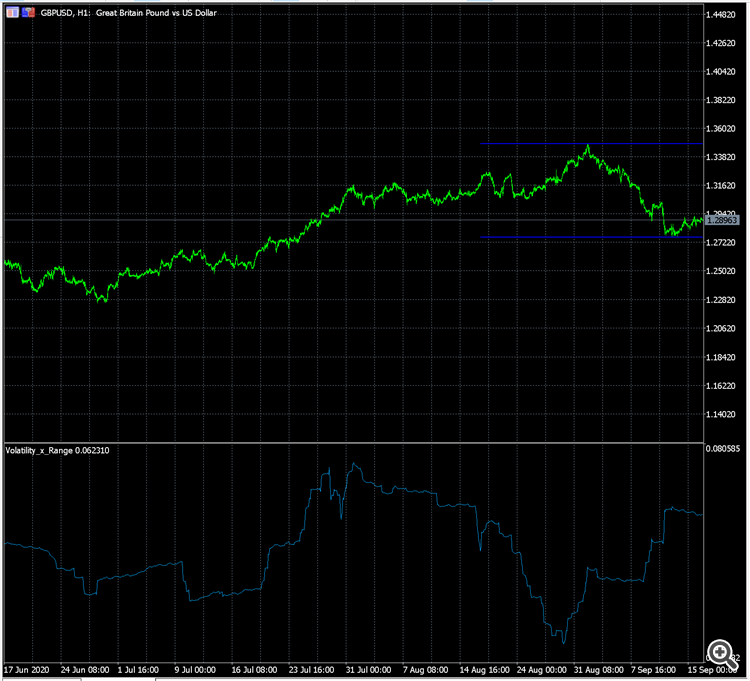
This Indicator is the Price Range Divided by the Sum of ALL candles within a certain amount of periods defined by user.
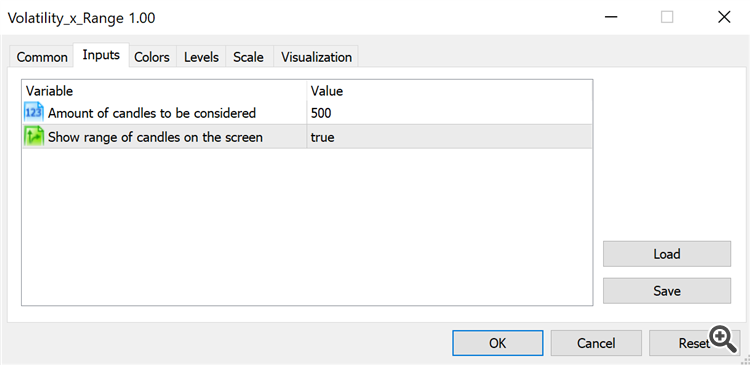
It has only has 2 inputs:
- The amount of candles to be considered
- Weather it should show the range in effect (Blue Horizontal Lines) to the screen or not .
Its main output on the separate scree, shows the main calculation:
- Lower numbers, closer to 0 indicate consolidation zones, where price keeps moving up and down, within a range. (Better for scalping EA, Grid EA or any EA that needs price to go back and forth without getting out of that range)
- Higher numbers, closer to 1, mean price movement is increasing the movement range, when defining a new trend, for example.