
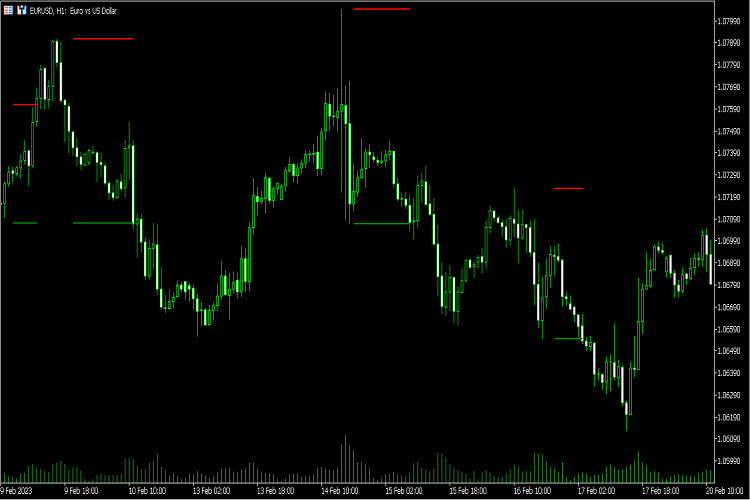
The basic idea behind the indicator is to check for bouncebacks between support and resistance levels. There are two input parameters: period and overlook. A support level is the lowest low in the last period bars if this value is equal to the lowest low of the last period+overlook bars. A resistance level is the highest high in the last period bars if it is equal to the highest high of the last period+overlook bars. If there are both support and resistance levels and a bounceback happens (price is between these levels) the support and resistance levels will be displayed on the chart.
In the original Indicator the i integer runs from period+overlook until rates_total, so the for cycle is for(i = rates_total-3;i<rates_total;i++). But for some reason I had to change that to validate my code.
Check out the video I've made about the mql4 version (there are a few differences between mql4 and mql5 but the logic is the same) :


