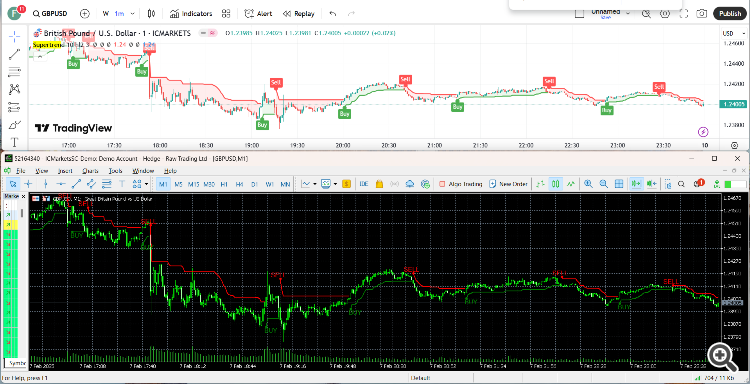
The purpose of this code is to convey an idea to people seeking simple and functional approach to converting pine script to MQL5.
You can download the compiled version here.
Here is the pine script code:
//@version=4 study("Supertrend", overlay = true, format=format.price, precision=2, resolution="") Periods = input(title="ATR Period", type=input.integer, defval=10) src = input(hl2, title="Source") Multiplier = input(title="ATR Multiplier", type=input.float, step=0.1, defval=3.0) changeATR= input(title="Change ATR Calculation Method ?", type=input.bool, defval=true) showsignals = input(title="Show Buy/Sell Signals ?", type=input.bool, defval=true) highlighting = input(title="Highlighter On/Off ?", type=input.bool, defval=true) atr2 = sma(tr, Periods) atr= changeATR ? atr(Periods) : atr2 up=src-(Multiplier*atr) up1 = nz(up[1],up) up := close[1] > up1 ? max(up,up1) : up dn=src+(Multiplier*atr) dn1 = nz(dn[1], dn) dn := close[1] < dn1 ? min(dn, dn1) : dn trend = 1 trend := nz(trend[1], trend) trend := trend == -1 and close > dn1 ? 1 : trend == 1 and close < up1 ? -1 : trend upPlot = plot(trend == 1 ? up : na, title="Up Trend", style=plot.style_linebr, linewidth=2, color=color.green) buySignal = trend == 1 and trend[1] == -1 plotshape(buySignal ? up : na, title="UpTrend Begins", location=location.absolute, style=shape.circle, size=size.tiny, color=color.green, transp=0) plotshape(buySignal and showsignals ? up : na, title="Buy", text="Buy", location=location.absolute, style=shape.labelup, size=size.tiny, color=color.green, textcolor=color.white, transp=0) dnPlot = plot(trend == 1 ? na : dn, title="Down Trend", style=plot.style_linebr, linewidth=2, color=color.red) sellSignal = trend == -1 and trend[1] == 1 plotshape(sellSignal ? dn : na, title="DownTrend Begins", location=location.absolute, style=shape.circle, size=size.tiny, color=color.red, transp=0) plotshape(sellSignal and showsignals ? dn : na, title="Sell", text="Sell", location=location.absolute, style=shape.labeldown, size=size.tiny, color=color.red, textcolor=color.white, transp=0) mPlot = plot(ohlc4, title="", style=plot.style_circles, linewidth=0) longFillColor = highlighting ? (trend == 1 ? color.green : color.white) : color.white shortFillColor = highlighting ? (trend == -1 ? color.red : color.white) : color.white fill(mPlot, upPlot, title="UpTrend Highligter", color=longFillColor) fill(mPlot, dnPlot, title="DownTrend Highligter", color=shortFillColor) alertcondition(buySignal, title="SuperTrend Buy", message="SuperTrend Buy!") alertcondition(sellSignal, title="SuperTrend Sell", message="SuperTrend Sell!") changeCond = trend != trend[1] alertcondition(changeCond, title="SuperTrend Direction Change", message="SuperTrend has changed direction!")


