
This indicator plots highs and lows as well as the open and close for the candle of the selected period. It is a multi-timeframe indicator which plot plot specific OHLC levels on the timeframe of your choice.
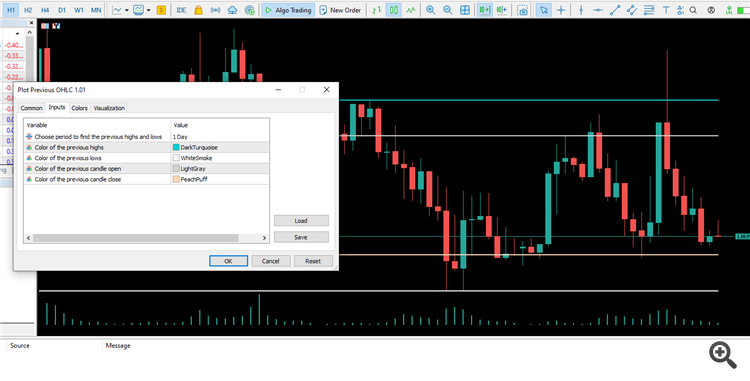
A shift input is included in the latest revision. A shift of 0 means the current bar OHLC, a shift of 1 means one bar back before the current (previous).


